
Sysco Corporation (SYY) stands as a global leader in selling, marketing, and distributing food products, kitchen equipment, and related products primarily to restaurants, healthcare, and educational facilities, as well as lodging establishments. Founded in 1969 and headquartered in Houston, Texas, Sysco has grown to serve over 600,000 client locations worldwide, showcasing its vast distribution network that spans numerous countries. Notably, Sysco is recognized for its financial resilience and commitment to shareholder value, as evidenced by its impressive record of increasing its dividend for 52 consecutive years.
This remarkable achievement places Sysco among the elite group of Dividend Kings, a testament to its consistent performance and strategic financial management. The company’s ability to maintain a steady growth in dividends over such an extended period highlights its robust business model, operational efficiency, and the strength of its market position in the food distribution industry. Sysco’s ongoing dedication to innovation, customer service, and sustainability further solidifies its status as a key player in the global food service distribution sector.
Analyst Ratings
- Kelly Bania from BMO Capital maintains a Buy rating on the stock, raising the price target from $85 to $90, indicating an upside of +11.33% as of January 31, 2024.
- Jeffrey Bernstein of Barclays also maintains a Buy rating, with the price target increased from $85 to $90, matching the +11.33% upside, dated January 31, 2024.
- Joshua Long from Stephens & Co. maintains a Buy rating, adjusting the price target from $80 to $90, suggesting an +11.33% upside on January 31, 2024.
- John Glass at Morgan Stanley maintains a Hold rating on the stock, with a slight increase in the price target from $75 to $76, reflecting a -5.99% downside as of November 1, 2023.
- In a previous rating by Joshua Long of Stephens & Co. on November 1, 2023, the price target was adjusted from $90 down to $80, indicating a slight -1.04% downside, while maintaining a Buy rating.
Insider Trading
Analyzing the insider buying and selling transactions for the stock over the last 6-12 months reveals a pattern of strategic investments and divestments by company insiders. The data shows a mix of contract buys and sales post-exercise, reflecting both confidence in the company’s future and the realization of gains from stock options.
Insider purchases, particularly contract buys, were executed at prices that suggest a belief in the stock’s value and potential for growth. For instance, on December 29, 2023, multiple insiders, including Edward D. Shirley, Daniel J. Brutto, and Ali Dibadj, engaged in contract buys at $73.04, indicating a coordinated belief in the stock’s underappreciation. Similarly, other contract buys throughout the year, including those on September 29, 2023, and June 30, 2023, at varying prices, further underscore the ongoing insider confidence in the company’s prospects.
On the selling side, transactions labeled as “Sale Post-exercise” suggest insiders are capitalizing on the vesting of their stock options, a common practice that allows insiders to realize gains. For example, James Chris Jasper and Neil A. Russell engaged in sales post-exercise in December 2023 and September 2023, respectively, suggesting a pattern of insiders optimizing their compensation packages. These sales, however, do not necessarily indicate a lack of confidence in the company’s future but rather personal financial management or diversification strategies.
This mix of buying and selling activity among insiders can provide valuable signals to investors about the stock’s potential direction. The insider buying actions, particularly the repeated contract buys across several dates, reflect a positive outlook on the company’s valuation and future performance. Conversely, the selling activity, primarily through the execution of stock options, might be seen as routine financial planning rather than a bearish signal on the stock’s future.
Dividend Metrics
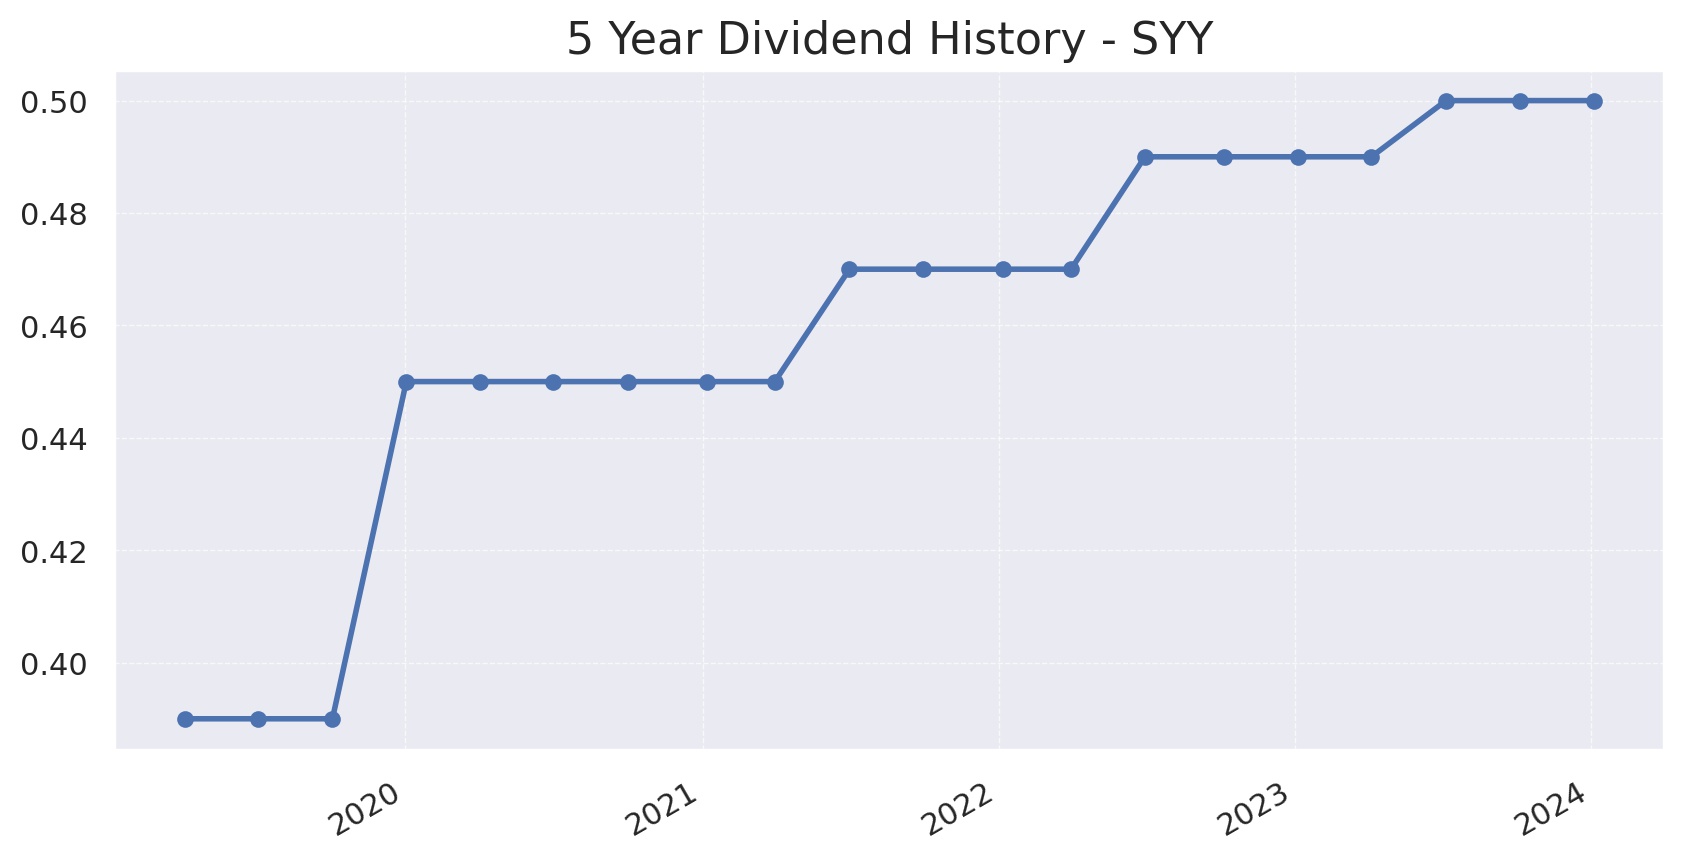
Sysco Corporation (SYY) showcases a remarkable consistency in shareholder returns, with a 52-year streak of dividend increases, underscoring its status as a Dividend King. The company currently offers a yield of 2.47%, slightly above its five-year average yield of 2.46%. This is coupled with a substantial five-year dividend growth rate of 19.56%, reflecting a strong commitment to growing shareholder value.
Over the past year, Sysco has also experienced revenue growth of 3.70%, signaling a positive trajectory in sales. Its payout ratio stands at a moderate 48%, suggesting that less than half of the company’s earnings are distributed as dividends, which supports both the sustainability of the dividend and the potential for future increases. Finally, Sysco has delivered a one-year return of 3.72%, providing a modest capital appreciation on top of its dividend yield. Together, these metrics paint a picture of a company with a firm grip on financial health and a solid track record of returning value to its shareholders.
Dividend Value
Sysco Corporation’s (SYY) current dividend yield stands at 2.47%, which is just a hair’s breadth above its five-year average yield of 2.46%. This near parity suggests a stable yield environment for the stock over an extended period. Investors looking at the yield as a measure of income relative to stock price will find Sysco’s yield consistency appealing, as it implies a steady performance in providing shareholder returns relative to its market price.
The consistency in yield also potentially indicates that the company has managed to sustain its dividend payouts in proportion to its stock price, which may be reflective of a careful balance between maintaining investor expectations and managing its growth and operational strategies. This balance might appeal to investors who are seeking a combination of income generation and stability in a stock that operates within the dynamic food distribution industry.
Income statement Analysis
Over the past few years, SYY’s financial performance has been like a fine wine, getting better with age—or, in this case, with each fiscal year. From the fiscal year ending in 2020 to the trailing twelve months ending June 30, 2023, total revenue grew from a modest $52.9 million to a robust $77.5 million, showcasing a growth trajectory that would make even the most stoic of investors raise an eyebrow. The journey of cost of revenue during the same period wasn’t as thrilling, but it played a crucial supporting role, increasing from $42.9 million to $63.2 million. This increase in cost directly contributed to gross profit’s upward trend, climbing from $9.9 million to an impressive $14.3 million, suggesting that SYY has been squeezing efficiency out of every dollar like it’s trying to make orange juice from oranges that are already juiced.
Diving deeper into the numbers, the operating income and net income also tell a tale of triumph, leaping from $749,505 to $3.2 million and $215,475 to $2.1 million, respectively. It’s as if SYY’s financials decided to hit the gym and bulk up, with the operating income flexing the most muscle growth. Amidst this financial feast, the diluted earnings per share (EPS) saw a growth from a mere $0.42 to a much more substantial $4.09, indicating that the earnings power per share has been on a steak-like upward trajectory—juicy and satisfying. Despite the occasional hiccup in net non-operating interest income expense and other income expense, which seems to dance around like a disco maniac, the overall pre-tax income smoothly waltzed from $293,384 to $2.7 million. This financial narrative, devoid of any roller coaster analogies, showcases SYY’s journey from being a financial lightweight to a heavyweight contender in the ring of revenue and profits.
Balance sheet Analysis
Navigating through SYY’s balance sheet is akin to exploring a financial jungle, where the flora and fauna are assets, liabilities, and equity figures that have evolved over the years. From 2020 to the trailing twelve months ending June 30, 2023, total assets have played a game of financial leapfrog, jumping from $22.6 million to slightly dipping in 2021, before ascending to a peak of $22.8 million. It’s as though the assets decided to go on a mild hike rather than a steep climb. The liabilities, not wanting to be outdone, have had their own narrative, initially scaling to $21.4 million in 2020, then taking a brief siesta in 2021 and 2022, only to awaken slightly more invigorated at $20.7 million in 2023. This subtle dance between assets and liabilities has left equity figures to tell tales of modest growth, from a humble abode of $1.2 million in 2020 to a more comfortable cottage at $2 million in 2023, showcasing a financial glow-up that many can only dream of.
Peeking into the more intricate corners of the balance sheet, the net tangible assets and total debt figures seem to have engaged in a seesaw battle, with net tangible assets humorously deciding to play the villain, staying firmly in the negatives, as if asserting that tangible value is overrated in today’s digital age. On the other side, total debt has had its own roller coaster—apologies, let’s say it has been more like a scenic train ride through the mountains—peaking at $15 million in 2020 before descending to a more serene $11.1 million by 2023. This financial journey, devoid of any steep drops or loop-the-loops, paints a picture of SYY’s balance sheet maneuvering through the fiscal years with the grace of a ballet dancer, occasionally stumbling but always finding its footing.
Cash Flow Statement Analysis
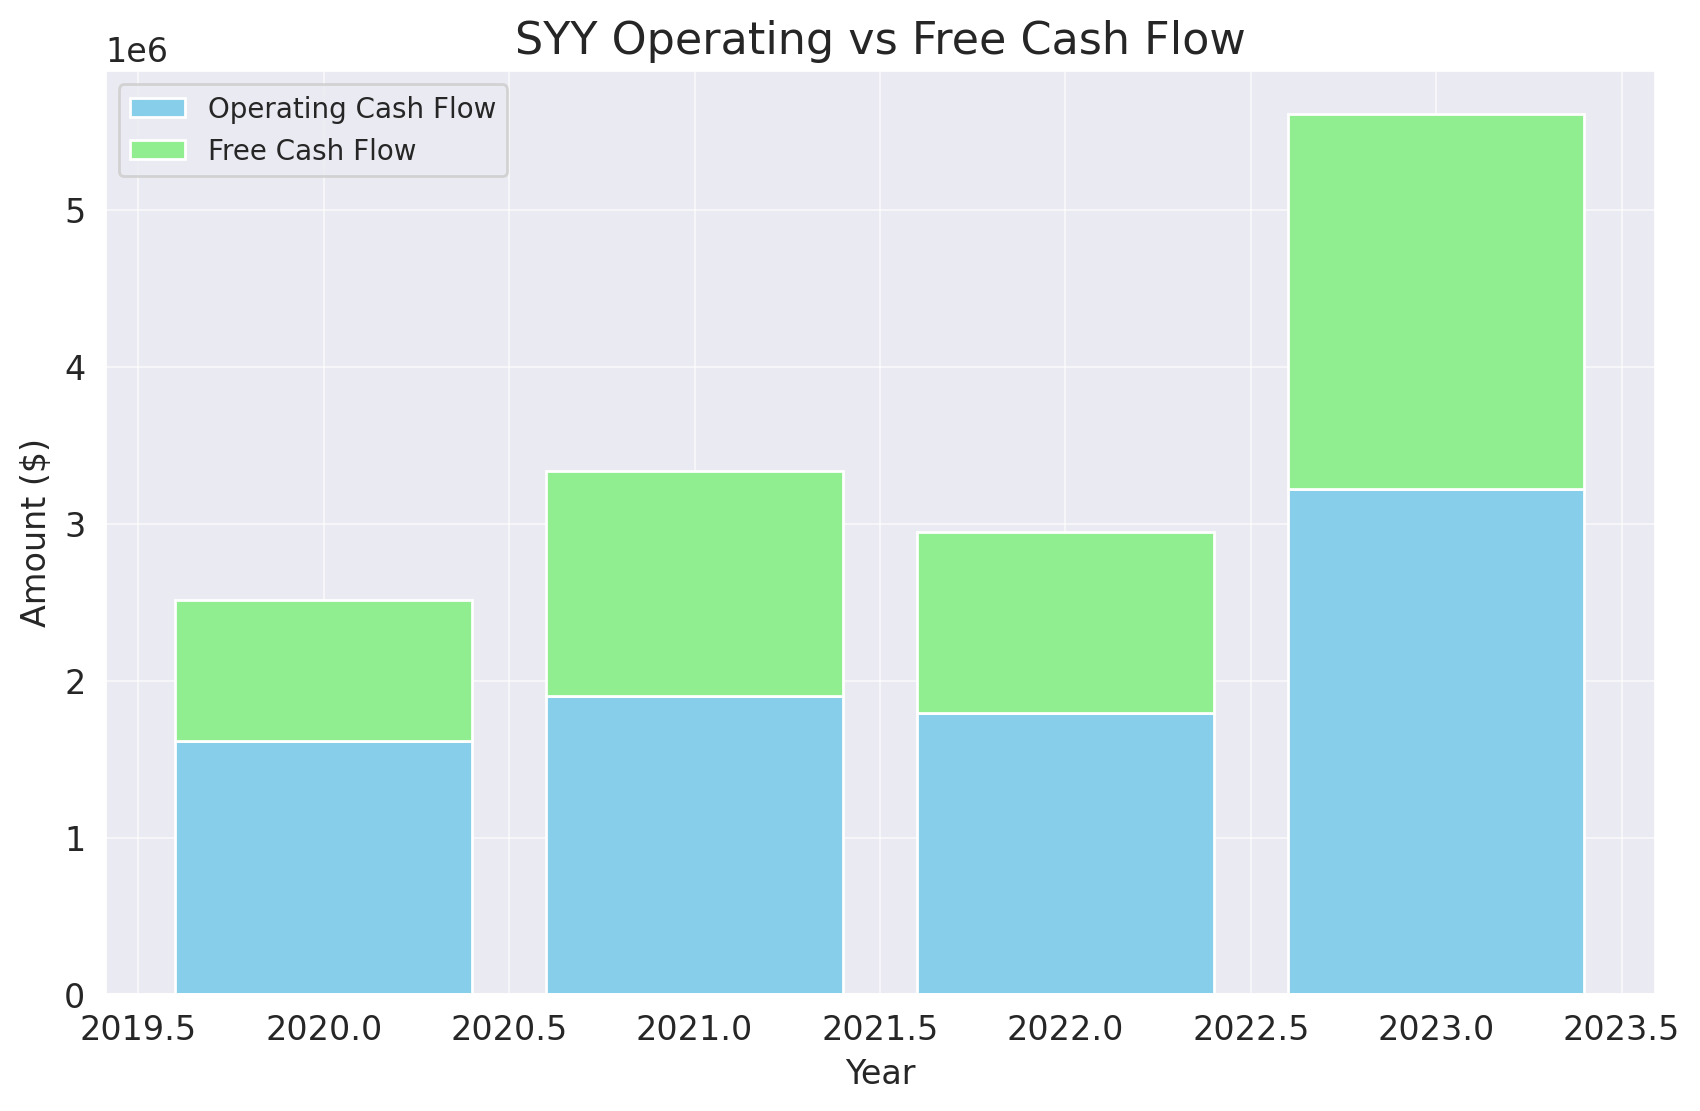
Exploring SYY’s cash flow statement over the years is akin to watching a financial drama unfold, with twists and turns that could rival any soap opera. The operating cash flow, the protagonist of our story, has been on an admirable journey of growth, starting from a modest $1.6 million in the fiscal year ending in 2020, and making a grand entrance to $3.2 million in the trailing twelve months ending June 30, 2023. This protagonist’s journey wasn’t without its challenges, notably a slight detour in 2021, but it eventually found its stride, showcasing resilience that would make any investor’s heart swell with pride. Amidst this, the investing and financing cash flows playedsupporting roles, with investing cash flow dipping its toes into the negative territory as if it’s fond of underwater adventures, and financing cash flow swinging wildly from being a hero with a $4.7 million inflow in 2020 to taking on a more villainous role with outflows in the subsequent years.
On the flip side, the end cash position, akin to the final scene of our financial drama, presents a plot twist with its dramatic descent from a peak of $6.1 million in 2020 to a more grounded $1.08 million by 2023, as if reminding us that all good things must come to a prudent and measured end. This narrative is peppered with subplot twists like capital expenditures and debt movements, where capital expenditure acts like a disciplined saver, always looking for ways to invest for the future, and the debt storyline weaves through issuance and repayment episodes, adding layers of complexity to our tale. Through the ups and downs, SYY’s cash flow statement tells a story of adaptation, strategic decisions, and the occasional surprise, much like a financial thriller where the suspense is in the numbers and the climax is always fiscal year-end.
SWOT Analysis
A SWOT analysis for Sysco Corporation (SYY) involves examining the company’s Strengths, Weaknesses, Opportunities, and Threats to understand its competitive position and future potential. This analysis provides a comprehensive overview of internal and external factors that could impact the company’s success.
Strengths:
- Market Leadership: Sysco is a leading global distributor of food products to restaurants, healthcare and educational facilities, lodging establishments, and other customers who prepare meals away from home. Its dominant position in the market provides significant competitive advantages in terms of scale, distribution network, and customer relationships.
- Diverse Product Portfolio: The company offers a wide range of products, including fresh and frozen foods, dairy, bakery, and beverage products, which helps mitigate risks associated with fluctuations in demand for specific product categories.
- Strong Supply Chain: Sysco’s efficient supply chain and logistics capabilities enable it to deliver products effectively across various geographies, enhancing customer satisfaction and retention.
- Innovative Solutions: The company’s focus on innovation, including digital ordering platforms and supply chain optimizations, strengthens its market position and customer service capabilities.
Weaknesses:
- Dependence on the Foodservice Industry: A significant portion of Sysco’s revenue comes from the foodservice sector, making it vulnerable to downturns in the restaurant and hospitality industries, as seen during the COVID-19 pandemic.
- Operational Costs: The nature of Sysco’s business involves high operational costs, including transportation and warehousing, which can impact margins in the face of rising fuel prices or logistical challenges.
- Regulatory Compliance: Operating in the food distribution industry, Sysco faces stringent regulations regarding food safety and handling, requiring continuous investment to ensure compliance and avoid potential legal issues.
Opportunities:
- Expansion into New Markets: There is potential for Sysco to expand its geographical presence, especially in emerging markets where the demand for foodservice distribution is growing.
- Acquisitions and Partnerships: Strategic acquisitions and partnerships can offer Sysco new customer segments, technologies, and product offerings, fueling growth and diversification.
- Sustainability and Health Trends: Increasing consumer demand for sustainable and healthy food options presents an opportunity for Sysco to expand its product offerings in these categories, enhancing its competitive edge.
Threats:
- Economic Fluctuations: Economic downturns can significantly impact the foodservice industry, leading to reduced demand for Sysco’s products and services.
- Competitive Pressure: The food distribution industry is highly competitive, with both national and regional players. Increasing competition could pressure prices and margins.
- Supply Chain Disruptions: Sysco’s operations are susceptible to disruptions in the supply chain, whether from natural disasters, geopolitical tensions, or pandemics, which can impact product availability and costs.
In summary, while Sysco holds a strong position in the food distribution industry with its broad product range and efficient supply chain, it must navigate challenges related to economic sensitivity, operational costs, and competitive pressures. Leveraging opportunities for expansion, innovation in product offerings, and strategic acquisitions could further strengthen its market position.
Competitors
Sysco Corporation, a leading global distributor of food products, operates in a competitive landscape characterized by several key players that vie for market share in the foodservice distribution industry. The top competitors often vary by region, product offerings, and market focus, but generally include companies that provide similar broadline and specialty distribution services. Here’s a summary of five of Sysco’s top competitors:
- US Foods Holding Corp. – As one of the largest foodservice distributors in the United States, US Foods is a direct competitor to Sysco, offering a wide range of products including fresh, frozen, and dry food items, as well as non-food products. US Foods serves a variety of customers such as restaurants, healthcare facilities, and educational institutions.
- Performance Food Group (PFG) – This company is another key competitor in the foodservice distribution market, providing a broad spectrum of food and food-related products to customers across the United States. Performance Food Group caters to independent and chain restaurants, schools, business and industry locations, and healthcare facilities, among others.
- Gordon Food Service (GFS) – GFS is a major foodservice distributor in North America, offering services to restaurants, educational institutions, healthcare facilities, and other foodservice operations. With a strong presence in the Midwest and throughout Canada, GFS is known for its broad product lines and value-added services.
- Reyes Holdings – Reyes Holdings operates through its foodservice division, Reyes Foodservice, LLC, distributing a wide variety of food and non-food products to restaurants and other foodservice outlets. It is one of the largest privately held companies in the United States and serves a broad customer base.
- McLane Company – While primarily known for its supply chain services to the convenience retailing industry, McLane also provides foodservice solutions, offering a range of food products and logistical services to restaurants, convenience stores, and fast-food operations. Its diversified distribution capabilities make it a notable competitor in the foodservice sector.