SJW Group is a U.S.-based water utility company that provides water service to more than one million people in the United States. The company operates through its subsidiaries, primarily focusing on the production, purchase, storage, purification, distribution, wholesale, and retail sale of water. SJW Group has a long-standing commitment to delivering reliable and high-quality water service, underpinned by significant investments in water infrastructure, technology, and environmental sustainability initiatives.
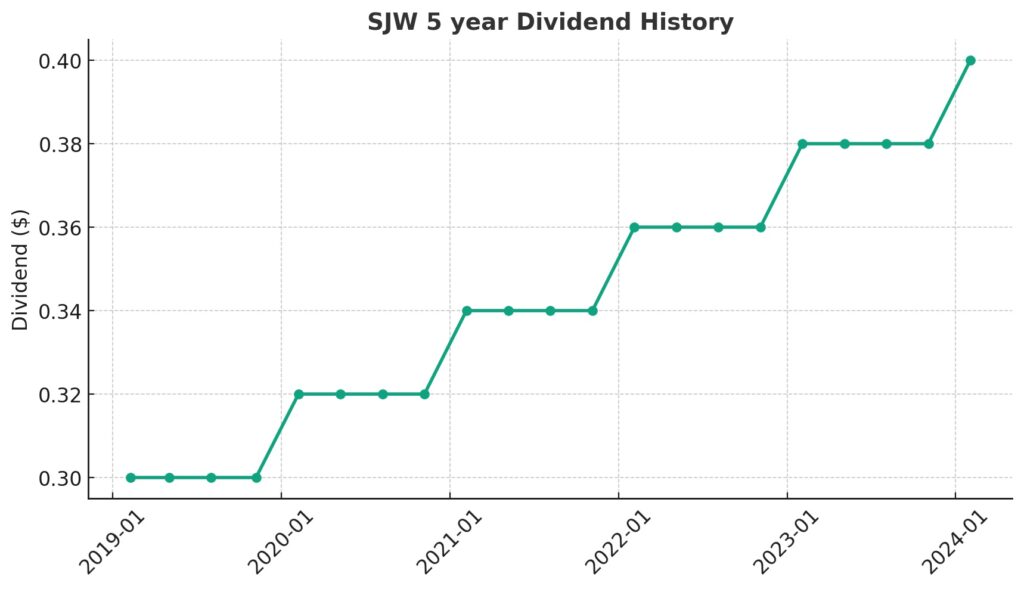
A standout feature of SJW Group is its remarkable track record in dividend payments. The company has consistently increased its dividend for 55 consecutive years, a milestone that places it within the elite group known as the Dividend Kings. This prestigious classification is reserved for companies that have a history of increasing their dividends for at least 50 consecutive years, demonstrating not only financial stability and resilience but also a strong commitment to returning value to shareholders. SJW Group’s inclusion in the Dividend Kings list underscores its solid financial performance over the years, its robust business model, and its ability to generate steady cash flows, making it an attractive option for income-focused investors.
Analyst Ratings
– Jonathan Reeder of Wells Fargo upgraded SJW Group from “Sell” to “Hold” on Oct 25, 2023, with a price target of $61, indicating a potential upside of +3.46%.
– Ross Fowler of UBS maintained a “Hold” rating on Oct 4, 2023, adjusting the price target from $78 to $60, suggesting a potential upside of +1.76%.
– On Sep 20, 2023, Jonathan Reeder from Wells Fargo maintained a “Sell” rating, revising the price target from $72 to $67, with a forecasted upside of +13.64%.
– Shelby Tucker of RBC Capital maintained a “Hold” rating on Sep 6, 2023, reducing the price target from $85 to $76, indicating a potential upside of +28.90%.
– Ross Fowler of UBS downgraded SJW Group from “Strong Buy” to “Hold” on Jun 6, 2023, with a revised price target from $85 to $78, predicting a potential upside of +32.29%.
Insider Trading
Analyzing the insider buying and selling transactions for the stock over the last 6-12 months, focusing exclusively on buy and sell activities (excluding awards and transfers), we observe the following pattern of insider sales:
- Eric W Thornburg (Chair & CEO):
- Sold 2,667 shares at $76.44 on Feb 28, 2023, resulting in $203,866, with post-transaction holdings of 48,776 shares.
- Sold 1,758 shares at $64.78 on Jan 3, 2024, resulting in $113,883, with post-transaction holdings of 55,556 shares.
- Sold 726 shares at $64.37 on Jan 4, 2024, resulting in $46,733, with post-transaction holdings of 54,830 shares.
- Andrew F Walters (CFO & Treas):
- Sold 429 shares at $76.44 on Feb 28, 2023, totaling $32,793, with post-transaction holdings of 15,925 shares.
- Sold 384 shares at $64.78 on Jan 3, 2024, totaling $24,875, with post-transaction holdings of 17,780 shares.
- Sold 186 shares at $64.37 on Jan 4, 2024, totaling $11,972, with post-transaction holdings of 17,594 shares.
- Sold 33 shares at $60.08 on Jan 26, 2024, totaling $1,983, with post-transaction holdings of 17,661 shares.
- Craig J Patla (Div. Pres.):
- Sold 725 shares at $76.09 on Mar 27, 2023, totaling $55,165, with post-transaction holdings of 7,038 shares.
- Sold 35 shares at $76.44 on Feb 28, 2023, totaling $2,675, with post-transaction holdings of 7,744 shares.
- Sold 272 shares at $64.78 on Jan 3, 2024, totaling $17,620, with post-transaction holdings of 8,431 shares.
- Sold 150 shares at $64.37 on Jan 4, 2024, totaling $9,655, with post-transaction holdings of 8,281 shares.
- Bruce A Hauk (COO):
- Sold 139 shares at $66.73 on Aug 22, 2023, totaling $9,275, with post-transaction holdings of 6,573 shares.
- Sold 521 shares at $65.398 on Jan 3, 2024, totaling $34,072, with post-transaction holdings of 8,448 shares.
This pattern of transactions predominantly involves sales post-exercise of options, indicating that insiders are choosing to sell shares after exercising their options, potentially to realize gains or manage their investment portfolios. Notably, there are no direct purchases (buy transactions) listed, suggesting that the insider activities have been focused on selling rather than buying shares in the market. This could reflect personal financial management decisions rather than a negative outlook on the company’s future prospects.
Dividend Metrics
SJW Group, trading under the ticker SJW, showcases a solid history of dividend reliability with a 55-year streak of dividend increases, highlighting its commitment to consistent shareholder returns. The stock presents a dividend yield of 2.56%, which is the result of a 5-year dividend growth rate of 10.76%.
The company’s revenue has been growing as well, with a 1-year revenue growth percentage of 16.40%. Its payout ratio stands at a sustainable 47%, ensuring that dividends are well covered by earnings. Over the past five years, the average dividend yield has been 2%, indicating a stable return from dividends. However, the 1-year return percentage reflects a challenging period for the stock price itself, which has seen a decline of 24.7%. This contrast suggests that while the company has been growing its dividend and revenue, investors have faced headwinds in the form of share price depreciation over the last year.
Dividend Value
The SJW Group stock presents a current dividend yield of 2.56%, which is slightly above its 5-year average yield of 2%. This higher current yield compared to the historical average suggests that the stock may be undervalued, assuming that the dividend payments are a reliable indicator of the company’s financial health. Investors often look at the dividend yield compared to historical averages to gauge whether a stock is trading at a discount or premium. In the case of SJW Group, a yield that exceeds the average might attract income-focused investors seeking higher returns on investment through dividends.
Typically, a higher yield can indicate that a stock’s price has fallen, making it more attractive to investors who prioritize dividend income. However, it is important to consider that yield is just one metric, and a comprehensive analysis would also account for factors like earnings stability, the overall financial position of the company, and market conditions. The current yield exceeding the 5-year average presents an opportunity for investors to potentially capitalize on this divergence, but such an investment would also warrant further scrutiny beyond just the yield metrics.
Income statement Analysis
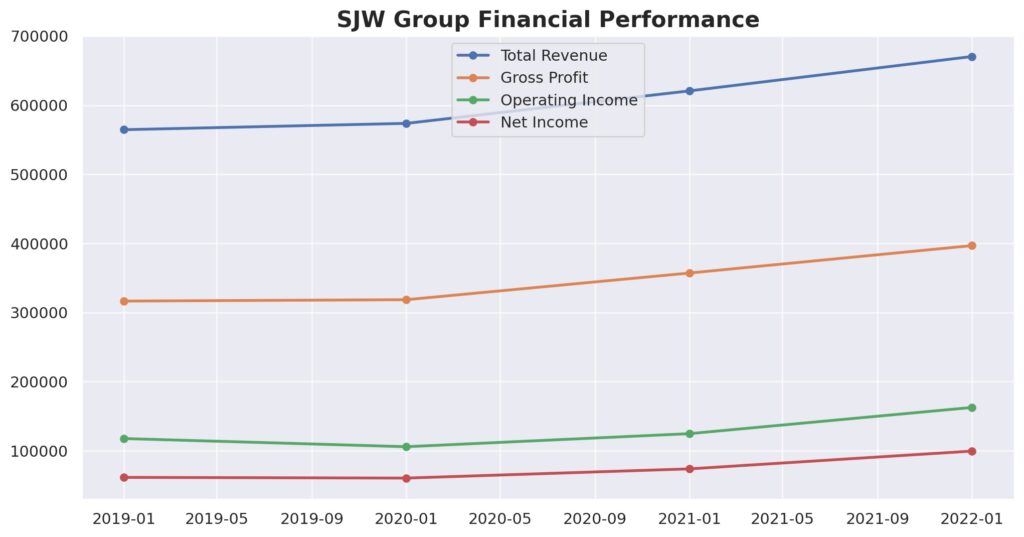
The income statement of SJW Group paints a picture of consistent top-line growth with total revenue stepping up each year from $564,526 TTM in 2019 to $670,399 TTM in 2022, like a well-practiced ballet of numbers rising to the occasion. The cost of revenue also pranced alongside revenues, albeit at a slightly less vigorous pace, ensuring that the gross profit’s ascent was not just a facade but had substance. The gross profit grew from $316,576 to $396,820 in the same period, which could be a cause for a modest celebration in the accounting department.
Diving deeper, the operating income followed the gross profit’s lead, increasing from $117,670 TTM in 2019 to a more robust $162,662 TTM in 2022. One might say that the company’s net non-operating interest income expense was not exactly playing the tune of ‘Happy Days Are Here Again’ with an increase from $-54,255 TTM to $-64,815 TTM, but the overall pretax income crescendoed from $69,895 TTM to $108,502 TTM. On the bottom line, net income available to common stockholders was not shy to show off its growth spurt from $61,515 TTM to $99,537 TTM. Despite the gravity of numbers, the diluted and basic EPS floated upwards from $2.14 and $2.16 to $3.19 and $3.21, respectively, possibly giving the shareholders a reason to walk with a little extra spring in their step.
Balance sheet Analysis
In the land of balance sheets, where assets and liabilities dance in a delicate balance, SJW Group has managed to grow its total assets from $3,311,465 TTM in 2020 to a more substantial $3,632,624 TTM by the end of 2022, which might make the asset column feel a little more bloated than usual. On the other side of the scale, total liabilities have also inched up, from $2,394,305 TTM to $2,521,756 TTM, as if trying to keep pace with their asset counterparts in some sort of fiscal fitness routine. This leaves total equity gross minority interest puffing up from $917,160 TTM to $1,110,868 TTM, which in the world of equity is the equivalent of a healthy year-over-year checkup.
When it comes to net tangible assets, SJW Group seems to have discovered the financial fountain of youth, increasing its vigor from $253,849 TTM in 2020 to $454,190 TTM in 2022. However, working capital appears to have taken a slight detour into the negatives, with -$109,936 TTM, suggesting that in the short term, the company’s financial trousers might be a bit tighter than preferred. On the long-term side, the total debt has risen to $1,655,903 TTM, perhaps hinting that SJW Group has been lifting weights with borrowed dumbbells. Nonetheless, the share count remains steady, which might be a small but comforting thought for shareholders not keen on dilution, like guests at a party relieved that the buffet isn’t running out just yet.
Cash Flow Statement Analysis
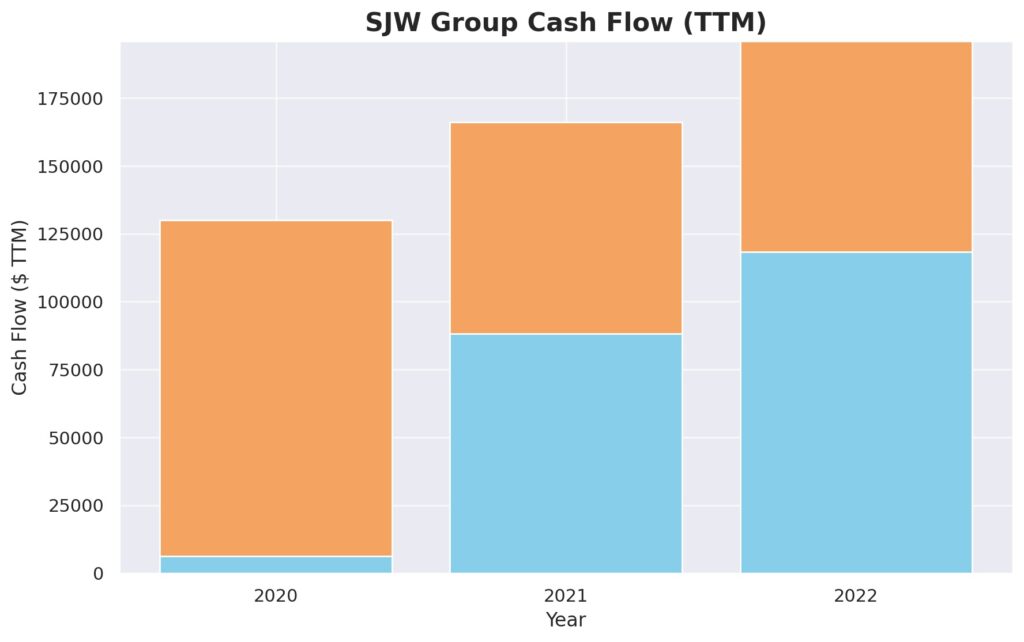
SJW Group’s cash flow statement tells a story of a company whose operating cash flow has been steadily hydrating its financial soil, growing from $104,051 TTM in 2020 to a more lush $196,153 TTM by the end of 2022. This uptick in operating cash flow suggests the company’s day-to-day business activities are generating more cash over time, potentially indicative of a company that’s getting better at squeezing juice from its operations. Investing cash flow, however, seems to have gone on a shopping spree, with $-304,616 TTM in 2022, suggesting that the company is investing heavily, possibly in search of growth, or maybe it just can’t resist a good sale on long-term assets.
Financing cash flow, which is akin to the company’s financial breathing, has been in flux with an inhale of $116,340 TTM, significantly higher than the previous year’s $78,354 TTM. It seems the company has been busy interacting with the capital markets, issuing debt and equity to keep the financial oxygen flowing. The end cash position, while not overflowing at $21,067 TTM, does show a step up from the modest $9,269 TTM in 2020, hinting that the company’s piggy bank is growing healthier. Despite the positivity, free cash flow appears to have been caught in a game of financial tug-of-war, ending at a strained $-77,815 TTM in 2022, which might make the free cash flow feel a bit like it’s on a financial diet.
SWOT Analysis
A SWOT analysis for SJW Group (symbol: SJW) would consider the company’s strengths, weaknesses, opportunities, and threats within the water utility sector. This analysis aims to provide a comprehensive view of the company’s strategic position.
Strengths:
- Long-standing dividend history: SJW Group has consistently increased its dividend for 55 consecutive years, showcasing its financial stability and commitment to returning value to shareholders.
- Solid market presence: With over a million people served, SJW Group has a significant footprint in the water utility industry, contributing to its strong market position.
- Infrastructure investments: The company’s continuous investments in water infrastructure, technology, and environmental sustainability initiatives demonstrate its commitment to quality service and operational efficiency.
Weaknesses:
- Regulatory challenges: As a utility company, SJW Group faces stringent regulations that can affect its operational flexibility and profit margins.
- Capital intensity: The nature of the water utility business requires substantial capital investments in infrastructure, which can strain financial resources and affect short-term financial performance.
Opportunities:
- Expansion and acquisitions: There are opportunities for growth through strategic acquisitions and expansion into new markets, which can increase the company’s customer base and revenue streams.
- Sustainability and innovation: Focusing on sustainable water management and innovative technologies can differentiate SJW Group from competitors and cater to the growing demand for environmentally friendly practices.
Threats:
- Environmental risks: Water scarcity, climate change, and natural disasters pose significant risks to water utilities, potentially impacting supply and increasing operational costs.
- Competitive pressure: The utility sector is becoming increasingly competitive, with new entrants and alternative water sources challenging traditional models and potentially eroding market share.
This SWOT analysis highlights SJW Group’s robust dividend history and market presence as key strengths, while also noting the challenges posed by regulatory environments and the capital-intensive nature of the industry. Opportunities for expansion and innovation could drive future growth, but environmental risks and competitive pressures represent ongoing threats to the company’s strategic position.
Competitors
Analyzing the competitive landscape for SJW Group involves looking at other key players in the water utility sector. Here’s a summary of five of SJW Group’s top competitors, each with its unique strengths and market positions:
- American Water Works Company, Inc. (AWK): As the largest publicly traded water and wastewater utility company in the United States, American Water Works serves millions of customers across 46 states. Its extensive geographic reach and diversified service portfolio make it a formidable competitor, offering water and wastewater services to residential, commercial, and industrial sectors.
- Aqua America, Inc. (WTRG): Now known as Essential Utilities, Inc., this company is one of the largest publicly traded water, wastewater service, and natural gas providers in the U.S., serving millions of people across multiple states. Its strategy of growth through acquisition and investments in infrastructure positions it as a strong competitor in the utilities sector.
- California Water Service Group (CWT): Operating in California, Washington, New Mexico, and Hawaii, California Water Service Group is a significant player in the water utility industry, particularly in the western United States. Its focus on customer service, sustainability, and community engagement helps it maintain a strong competitive position.
- Veolia Environnement S.A. (VEOEY): Although a global company based in France, Veolia operates in the United States through its subsidiary Veolia North America. It provides integrated environmental services, including water, waste, and energy management solutions. Veolia’s global presence and comprehensive service offerings make it a key competitor, especially for large-scale and industrial utility contracts.
- Suez Environnement S.A.: Like Veolia, Suez is a global player with operations in the United States, providing water and waste management solutions. Its commitment to innovation, sustainability, and the development of smart water systems for cities and industries puts it in direct competition with SJW Group, especially in markets that value technological and environmental advancements.


