
3M is a multinational conglomerate corporation operating in the fields of industry, worker safety, US health care, and consumer goods. The company is well-known for its innovation and diversity in product lines, including well-known products like Post-it Notes, Scotch tapes, and a range of medical supplies and equipment.
A hallmark of 3M’s financial stability and shareholder value is its impressive record of increasing dividends. Specifically, 3M has raised its dividend for 64 consecutive years, making it a distinguished member of the Dividend Kings. This exclusive group comprises companies that have a history of increasing their dividend payouts for at least 50 consecutive years, highlighting their reliability and long-term performance despite various economic cycles. 3M’s commitment to innovation, along with its consistent dividend growth, underscores its position as a solid investment and a leader in its respective markets.
Analyst Ratings
The five most recent analyst ratings for 3M (MMM) reflect a mix of opinions, with the majority suggesting a cautious stance on the stock:
- Citigroup maintained a Hold rating, adjusting the price target from $117 to $104 on January 24, 2024.
- Mizuho also maintained a Hold rating, lowering the price target from $120 to $105 on the same date.
- RBC Capital continued with a Sell rating, but increased the price target from $83 to $87, also on January 24, 2024.
- Wells Fargo kept its Hold rating, adjusting the price target from $112 to $105 on January 24, 2024.
- Barclays upgraded MMM from Sell to Hold, raising the price target from $98 to $107 on December 4, 2023.
These ratings suggest a consensus leaning towards a cautious or neutral outlook on 3M, with adjustments in price targets reflecting analysts’ updated views on the company’s valuation and future prospects.
Insider Trading
Focusing solely on buy and sell transactions for Chewy (CHWY) over the last six months, excluding awards and transfers, provides insight into direct financial actions taken by insiders that might reflect their confidence in the company’s future prospects or their response to the company’s current valuation. Here’s a breakdown of these transactions:
Buy Transactions:
- James A Star:
- Bought on 12/14/23: 12,242 shares at $20.3822, totaling approximately $249,519.
- Bought on 12/12/23: 15,353 shares at $19.6048, totaling approximately $300,993.
- These transactions suggest a positive outlook on the company’s future, indicating that James A Star sees value at these price levels.
Sell Transactions:
- American Shareholder:
- Sold on 01/09/24: 12,325,000 shares at $20.2900, totaling approximately $250,074,250. This significant sale represents a substantial reduction in exposure to CHWY, which could be for various reasons, including portfolio rebalancing or taking profits.
- Stacy Bowman (CFO & CAO):
- Sold on 10/18/23: 11,423 shares at $18.2400, totaling approximately $208,355. This sale, while smaller in scale compared to the American Shareholder, still indicates a decision to liquidate part of her stake in the company.
- Sumit Singh (CEO):
- Sale Post-exercise on 09/05/23: 785 shares at $24.9964, totaling $19,622. Although this is a relatively small transaction, it’s part of exercising options, which usually indicates covering expenses related to the option exercise or taking profits.
- Stacy Bowman (CFO & CAO):
- Sale Post-exercise on 09/05/23: 900 shares at $24.9964, totaling $22,497.
- Sale Post-exercise on 08/02/23: 465 shares at $32.6195, totaling $15,168.
- Sold on 07/26/23: 15,166 shares at $33.5200, totaling approximately $508,364.
- Sold on 07/12/23: 8,000 shares at $38.9500, totaling approximately $311,601.
- Michael Morant (General Counsel) and Stacy Bowman (PAO) also engaged in sales post-exercise, indicating similar financial motivations.
Analysis:
- Buying Behavior: James A Star’s purchases represent a clear vote of confidence in Chewy’s value and potential for growth, especially considering that these transactions were direct purchases on the open market.
- Selling Behavior: The sales observed, especially the substantial sale by the American Shareholder, might suggest a range of strategic motivations, from portfolio adjustments to responses to Chewy’s current market valuation or future outlook. It’s important to consider these sales in the context of the individuals’ overall investment strategy and the company’s performance.
Dividend Metrics
3M Company, with the symbol MMM, has a commendable track record of increasing its dividends for 64 years. The current dividend yield is high at 6.27%, and it has seen a five-year dividend growth rate of 5.38%. However, the past year wasn’t favorable in terms of revenue, which saw a slight drop of 0.80%. The payout ratio stands at 61%, indicating that a substantial portion of earnings is given back to shareholders as dividends. Over the past five years, the average yield has been 4.06%, but the one-year return percentage shows a notable decline of -17.36%.
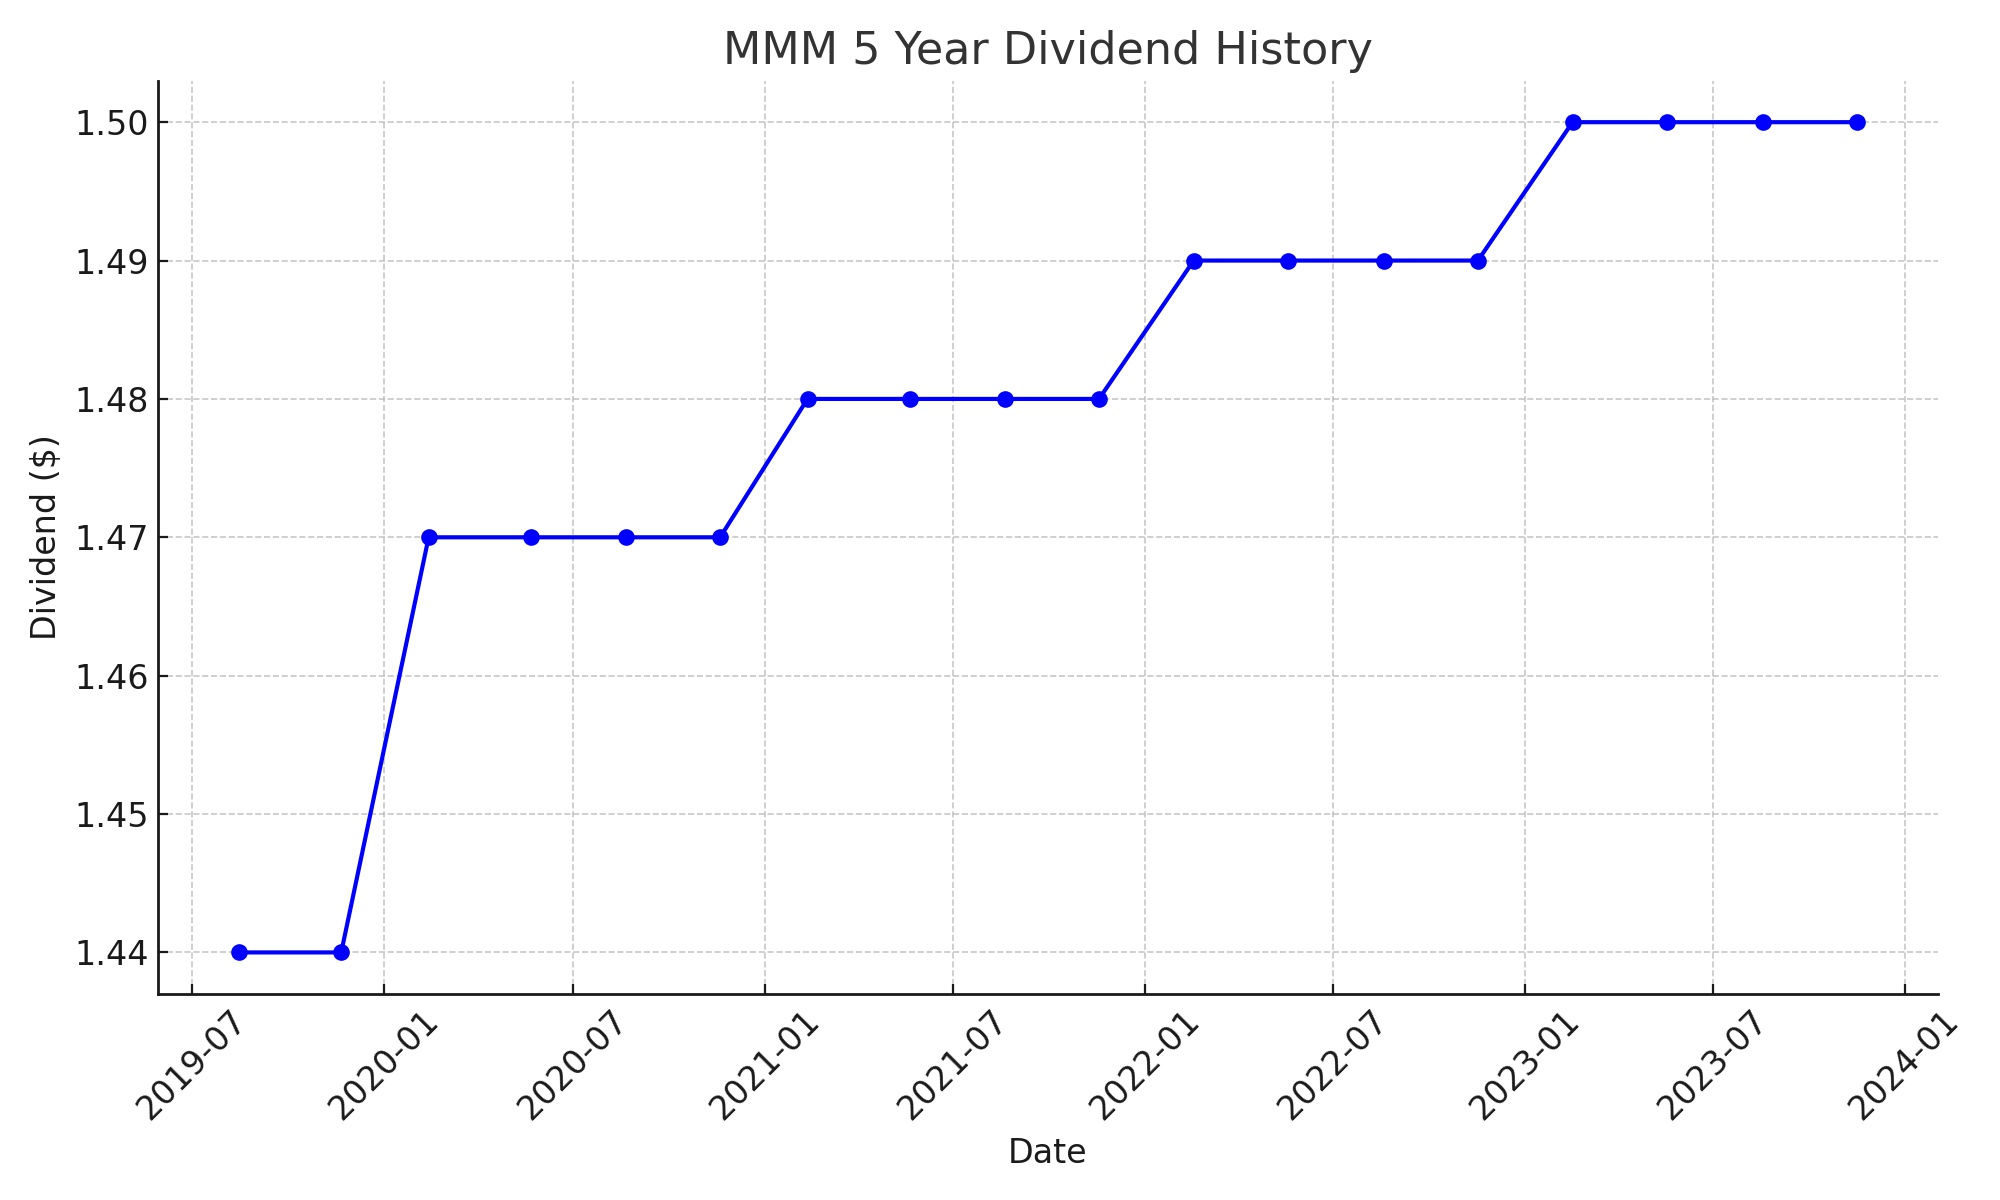
Dividend Value
3M Company’s current dividend yield of 6.27% stands out when compared to its five-year average yield of 4.06%. This elevated yield can often suggest that the stock might be undervalued, presenting a potentially attractive entry point for investors. The disparity between the current yield and the historical average might also reflect a recent drop in share price, which has the effect of inflating the yield percentage. Typically, such a significant yield increase could attract investors looking for income, especially if this level of yield is sustainable based on past company performance. However, it’s essential to approach the high yield with caution; while it may represent a good value, it could also be an indicator of market skepticism about the company’s future prospects, warranting a closer examination of the broader financial picture.
Income Statement Analysis
3M’s financial performance has been like a roller coaster with more downs than ups recently. The Trailing Twelve Months (TTM) show total revenue taking a dip at $32.7 billion, which might make investors nostalgic for the $35.3 billion peak in 2020. The cost of revenue is a bit like that mystery charge on your credit card statement — it just keeps going up, standing now at $18.3 billion. But here’s where it gets a bit humorous, or tragic, depending on your investment stake: the operating income has decided to play limbo, asking “How low can you go?” with a staggering negative $9.3 billion.
Meanwhile, the net non-operating interest income expense and other income expenses seem to be having their own private party, resulting in a pretax income that’s deep in the red at negative $10.09 billion. The company’s tax provision seems to have found a discount, with a benefit of $2.69 billion. At the bottom line, the net income available to common stockholders is also singing the blues to the tune of negative $7.4 billion. The basic and diluted earnings per share figures echo this sentiment, both harmonizing at negative $13.31, making shareholders miss the golden oldies of positive earnings per share from the past years.
Balance Sheet Analysis
Peering into 3M’s balance sheet is akin to watching a magician’s act, where assets slightly disappear from $47.3 billion in 2020 to $46.45 billion by the end of 2022, leaving the audience mildly perplexed. The liabilities, acting as the magician’s assistant, have also performed their own vanishing act, reducing from $34.4 billion to $31.68 billion over the same period, perhaps in a bid to balance the books or just for the sake of mystery.
Equity has seen a bit of a roller coaster, riding up from $12.9 billion to $15.1 billion, before slightly dipping to $14.77 billion, as if it remembered it left the stove on. On the tangibility front, 3M’s net tangible assets seem to have found a trapdoor, moving from a rather uncomfortable position of negative $6.77 billion to a slightly less uncomfortable negative $2.77 billion, suggesting some improvement in the magic tricks. The debt, however, seems to have been a stubborn audience member, slightly resisting the magician’s charms, decreasing from $19.75 billion to $16.85 billion, but leaving behind a net debt that still requires a wand wave at $12.28 billion. Watching the treasury shares and ordinary shares number shuffle around adds to the illusion, hinting at a complex performance of financial engineering worthy of a modest round of applause.
Cash Flow Analysis
3M’s cash flow narrative over the recent years is a tale of ebbs and flows, not unlike the journey of a river meandering through the landscapes of finance. In the realm of operating cash flow, we see a descent from the lofty heights of $8.1 billion in 2020 to a more grounded $6.6 billion in the trailing twelve months (TTM), suggesting that while the company’s operations remain profitable, they’ve seen more lucrative days. It’s as if the cash flow stream hit a few rocks along the way but continues to flow steadily.
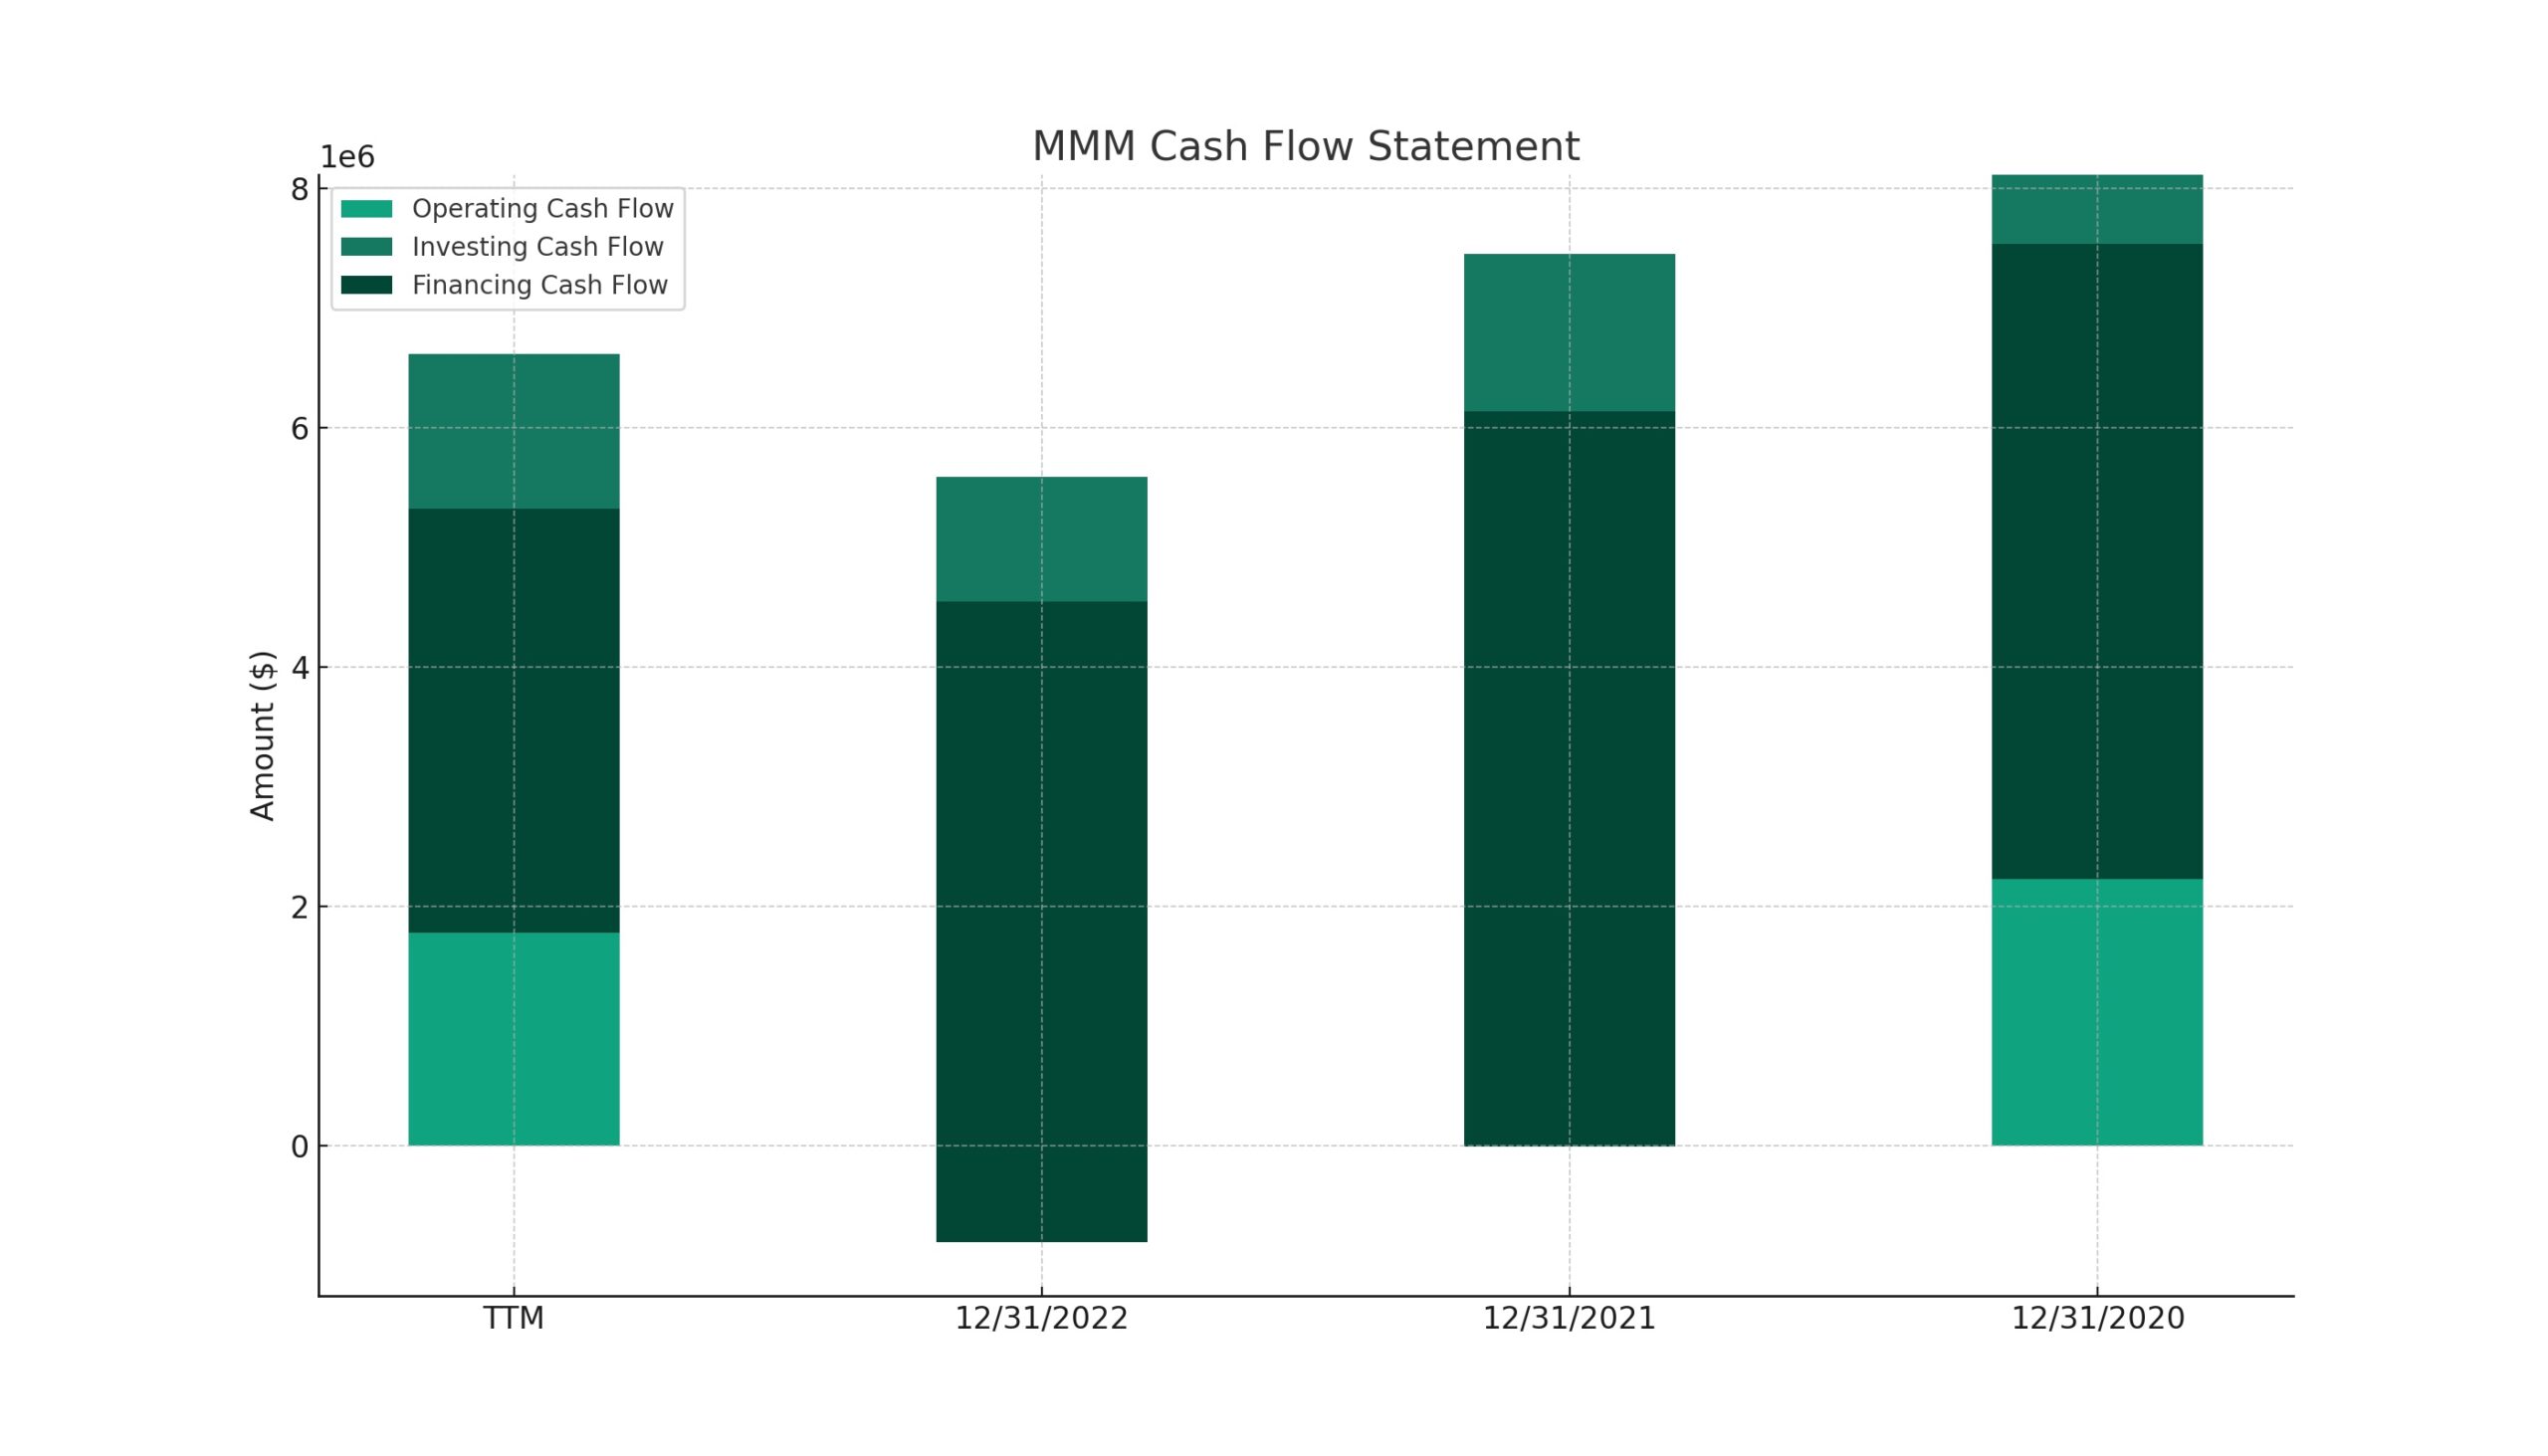
Investing activities have consistently seen money flowing out, albeit with a slight decrease in outflow in the TTM to $1.29 billion, indicating a cautious yet ongoing investment in the future. The financing cash flow tells a story of repayment and recalibration, with significant sums leaving the coffers ($3.54 billion TTM), as if 3M is a magician trying to make its debt disappear, only to find that the audience (the debt) demands a more impressive trick. The end cash position, like the final act of a financial drama, shows a bit of a recovery to $5.18 billion in the TTM, hinting at a potential plot twist for future seasons. Through all this, the subplot of capital expenditure reveals a consistent investment in the company’s growth, laying down the infrastructure for future episodes. The free cash flow, serving as the morale of the story, remains robust, offering hope that despite the ups and downs, the river of 3M’s cash flow navigates forward, ever resilient.
SWOT Analysis
To provide a SWOT analysis for 3M Company (MMM), let’s consider the company’s strengths, weaknesses, opportunities, and threats based on its financial performance, market position, and broader industry trends:
Strengths:
- Innovation and Diversification: 3M is renowned for its strong commitment to research and development, leading to a wide range of innovative products across multiple sectors, including healthcare, consumer goods, and industry.
- Global Presence: With operations in more than 70 countries, 3M has a significant global footprint, allowing it to leverage international markets and diversify its revenue streams.
- Brand Reputation: The company has built a strong brand reputation over the years, underpinned by its consistent delivery of quality products.
Weaknesses:
- Dependence on Global Supply Chains: 3M’s extensive reliance on global supply chains exposes it to risks related to trade tensions, tariffs, and supply chain disruptions.
- Legal and Regulatory Challenges: The company faces ongoing legal and regulatory challenges, including litigation related to environmental and health-related liabilities, which could impact financials and brand perception.
Opportunities:
- Growth in Emerging Markets: There’s significant potential for 3M to expand further in emerging markets, where increasing industrialization and consumer spending can drive demand for its products.
- Sustainability and ESG Initiatives: Increasing focus on sustainability and ESG (Environmental, Social, and Governance) factors presents opportunities for 3M to lead in developing eco-friendly products and processes.
Threats:
- Intense Competition: The diverse sectors in which 3M operates are highly competitive, with both established players and new entrants continuously challenging its market position.
- Economic Fluctuations: Global economic downturns can significantly affect demand for 3M’s products, especially in sectors sensitive to economic cycles like construction and industrial manufacturing.
This SWOT analysis highlights 3M’s ability to innovate and expand globally as key strengths, while also acknowledging the challenges it faces from legal issues, competition, and economic fluctuations. The company’s ability to navigate these factors effectively will be crucial to its future success.
Competition
3M’s top competitors include a mix of companies across various sectors, reflecting 3M’s diverse product portfolio. The top five competitors are:
- Corning: Known for its innovations in glass and ceramics, Corning competes directly with 3M in areas such as optical communications and specialty materials.
- General Electric (GE): A multinational conglomerate, GE operates in sectors like aviation, power, renewable energy, and healthcare, overlapping with several of 3M’s business units.
- Honeywell International: Competing in the industrial, safety, and consumer goods sectors, Honeywell shares a similar market space with 3M, particularly in safety products and technologies.
- Emerson: Specializing in automation solutions, Emerson competes with 3M in various industrial and consumer markets, particularly in process control systems and technologies.
- Avery Dennison: Operating in the materials science and manufacturing sector, Avery Dennison is a key competitor in areas related to adhesives, labels, and reflective materials, directly challenging 3M’s product lines.