
Johnson & Johnson (JNJ) stands as a paragon of resilience and growth in the global healthcare industry. Founded over a century ago, this behemoth operates across three main segments: Pharmaceuticals, Medical Devices, and Consumer Health Products. Its diverse product range, from life-saving drugs to everyday items like Band-Aids and Tylenol, has cemented JNJ’s status as a household name. The company’s commitment to innovation, coupled with a robust strategy for acquisitions and partnerships, has driven its growth and allowed it to address complex medical challenges effectively.
A testament to its financial health and shareholder value commitment, Johnson & Johnson has achieved an extraordinary feat by increasing its dividend for 60 consecutive years, earning it the prestigious title of a Dividend King. This achievement not only highlights its financial stability and profitability but also signals the company’s unwavering dedication to delivering consistent returns to its investors. In the fluctuating world of investments, JNJ emerges as a beacon of reliability, showcasing a blend of innovative prowess and financial diligence that few can match.
Analyst Ratings
- Louise Chen from Cantor Fitzgerald reiterates a “Buy” rating on the stock with a price target of $215, suggesting a +36.02% upside on Feb 6, 2024.
- Terence Flynn from Morgan Stanley maintains a “Hold” rating, adjusting the price target from $170 to $169, indicating a +6.92% upside on Jan 24, 2024.
- On the same day, Louise Chen (Cantor Fitzgerald) and Shagun Singh (RBC Capital) reiterated their “Buy” ratings with price targets of $215 (+36.02% upside) and $181 (+14.51% upside), respectively.
- Louise Chen confirmed the “Buy” rating and $215 price target (+36.02% upside) again on Jan 23 and Jan 9, 2024.
- Jayson Bedford from Raymond James maintained a “Buy” rating, updating the price target from $172 to $175, which translates to a +10.72% upside on Jan 3, 2024.
Insider Trading
Analyzing the insider buying and selling transactions for the stock over the last 6-12 months, while ignoring awards and transfers, provides insights into the behavior of key executives within the company. Here’s a breakdown of the significant buy and sell transactions:
Sell Transactions:
- Dr. Peter Fasolo (EVP) sold 20,000 shares at $170.3249 each on 07/25/23, totaling $3,406,498, with his holdings afterward standing at 102,696 shares, representing 0.0040% of the company.
- Kathryn E Wengel (Div. VP) sold 12,465 shares at $160.00 each on 06/12/23, accumulating $1,994,399, leaving her with 66,274 shares, or 0.0026% of the company.
- James D Swanson (CIO) sold 1,062 shares at $154.6600 each on 03/06/23, for a total of $164,200, with his post-transaction holdings at 9,215 shares, or 0.0004% of the company.
Buy Transactions:
- William Hait (Div. EVP) exercised options for 14,698 shares at $90.4400 each on 07/26/23, resulting in an expenditure of $1,329,288. Subsequently, he sold all 14,698 shares on the same day at $172.0000 each for $2,528,056, indicating a profitable exercise and sell strategy, with his holdings remaining at 87,747 shares, or 0.0034% of the company.
This summary indicates a trend of insiders selling their shares, potentially to realize gains or diversify their personal portfolios. The exercise and subsequent sale by William Hait highlight a common practice among executives to capitalize on stock options as part of their compensation package. Such transactions are noteworthy for investors as they can offer clues about insiders’ confidence in the company’s future prospects, though they should not be the sole basis for investment decisions.
Dividend Metrics
Johnson & Johnson (JNJ), a well-established player in the healthcare industry, has demonstrated a consistent commitment to rewarding shareholders, as evident by its impressive track record of increasing dividends for 60 years in a row. With a current dividend yield of 3%, the company has been able to increase its dividend payouts by an average of 5.87% over the past five years. However, the company has faced a downturn in revenue growth, with a 1-year revenue decline of 9.70%, which raises questions about recent financial performance.
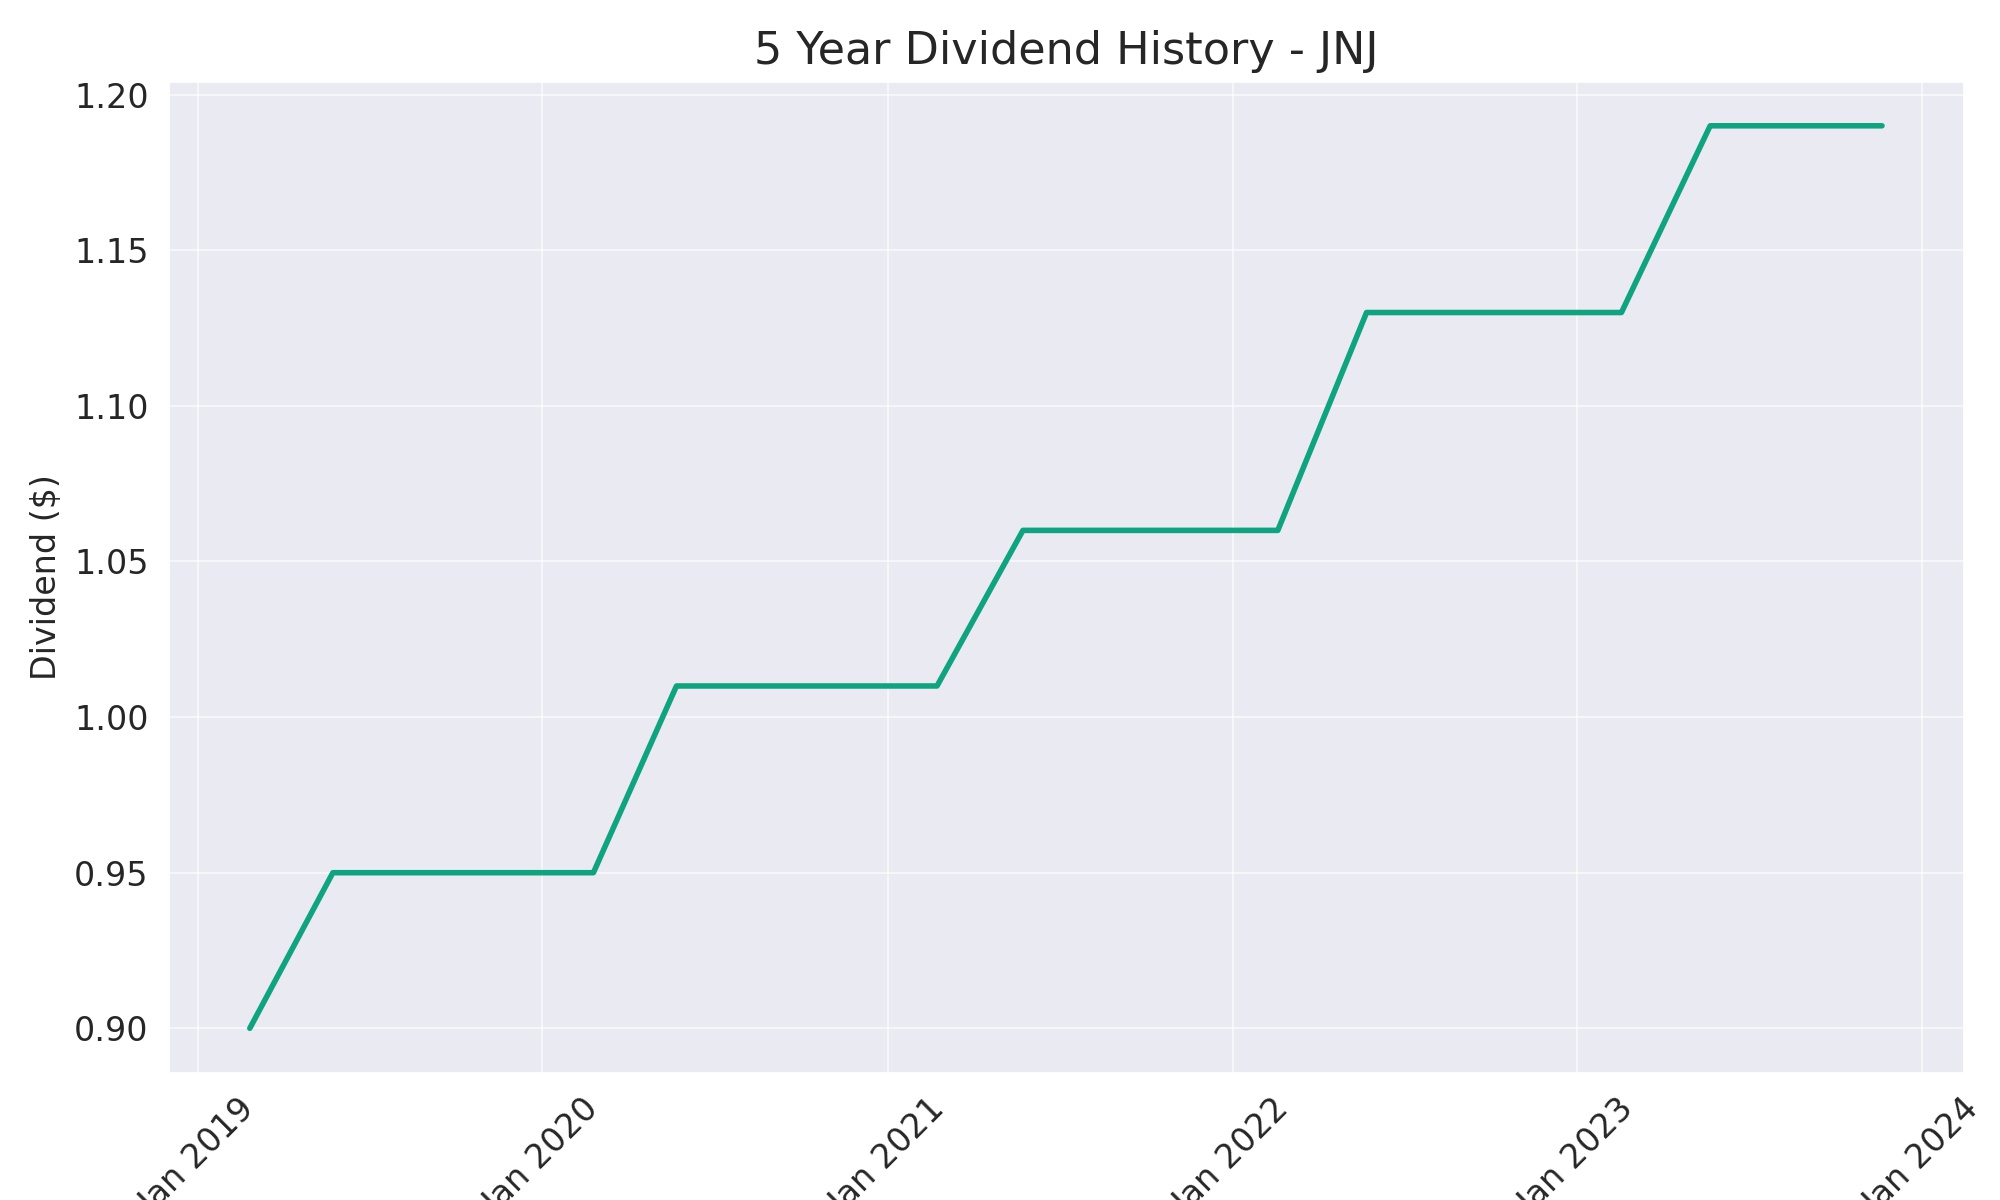
Despite this revenue contraction, the company has maintained a high payout ratio of 90%, indicating that a significant portion of earnings are being returned to shareholders as dividends. Over a 5-year period, the average dividend yield has been stable at 2.65%. However, over the past year, Johnson & Johnson has seen a slight setback in terms of stock performance, with a -3.73% return, potentially reflecting market volatility or specific challenges faced by the company during that period. This snapshot of financial metrics portrays a company with a strong tradition of shareholder dividends, though recent figures suggest there may be areas where the company is looking to improve or stabilize performance.
Dividend Value
In examining the value of Johnson & Johnson (JNJ) based solely on its dividend yield relative to its 5-year average yield, one observes a nuanced picture of investor returns. The current yield stands at 3%, which, when placed against the 5-year average yield of 2.65%, represents a higher immediate income return for investors relative to the recent past. This elevated yield could be interpreted as a potential value indicator, suggesting that the stock may be undervalued if one assumes that the underlying business fundamentals remain constant and that the market has not fully appreciated the stock’s income-generating potential.
However, the fact that JNJ’s current yield surpasses its 5-year average might also reflect broader market dynamics. It could signify that investors are demanding a higher yield to compensate for perceived risks or that the stock price has adjusted downward, pushing the yield up. This scenario warrants a closer look into the market’s assessment of JNJ’s future prospects and whether external factors such as interest rate changes or sector-specific headwinds have influenced investor sentiment, causing a divergence from historical yield patterns. Regardless, the current yield premium over the historical average offers an enticing figure for yield-focused investors.
Income statement Analysis
Glancing through the financial kitchen of our unnamed corporate chef, we find that the recipe for revenue has been on a subtle simmer, rising from $82,584,000 to a more robust $98,656,000 over the TTM. This growth could be likened to a well-risen dough, indicating a steadily expanding appetite for the company’s offerings. The cost of cooking up these revenues, or the cost of revenue, has also thickened modestly from $28,427,000 to $32,332,000, hinting at pricier ingredients or perhaps a few too many chefs in the kitchen.
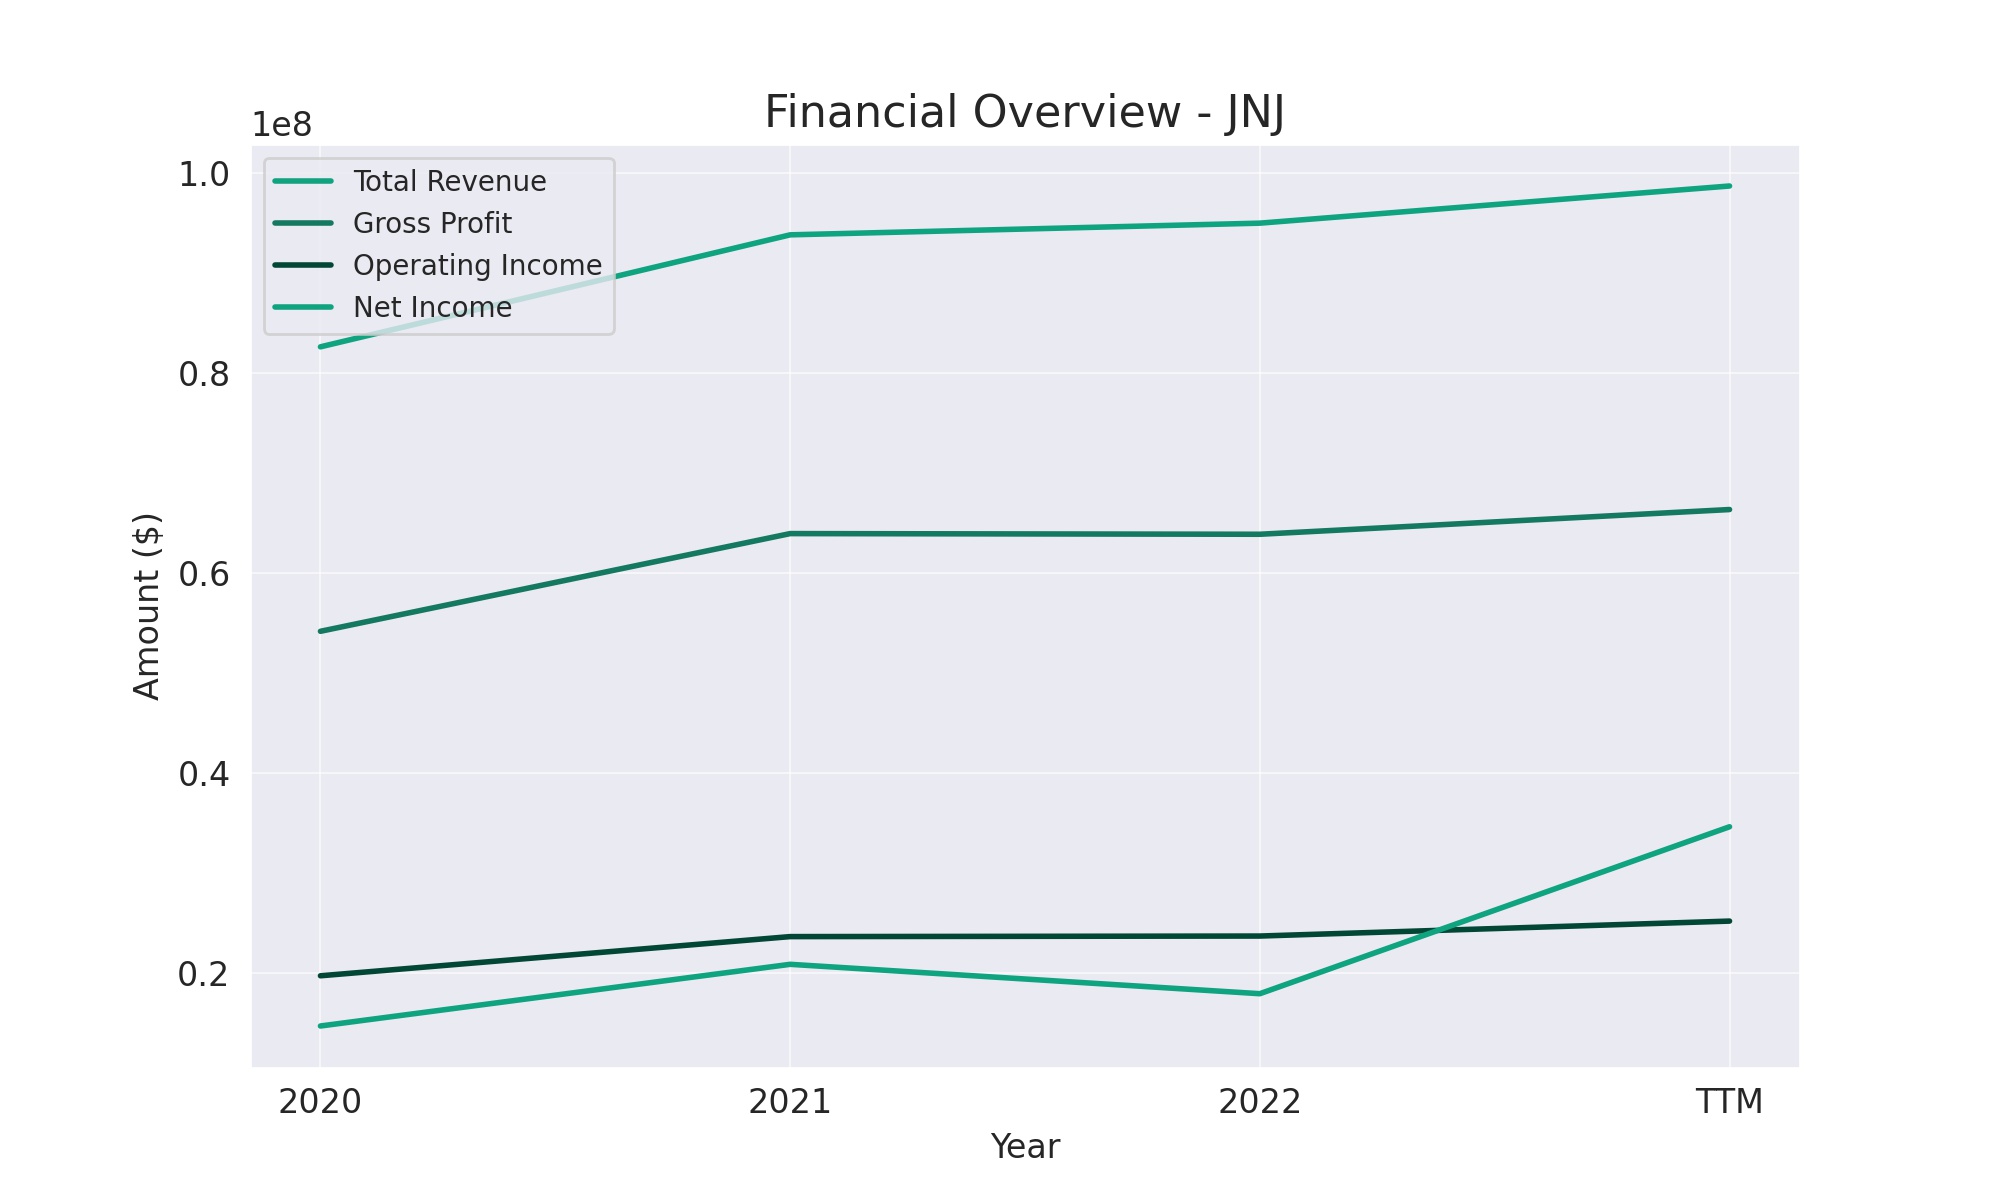
The garnish on this fiscal feast is the operating income, which after deducting the operational herbs and spices, has plated up from $19,733,000 to $25,198,000 TTM. But let’s not forget the after-dinner mint, the net income for common stockholders, which has seen a more dramatic jump, more than doubling from $14,714,000 to $34,624,000 in the TTM. This surprising leap could suggest a secret sauce in the company’s financial strategy, or perhaps a generous accounting fairy sprinkling some favorable one-time items into the mix. With this kind of performance, investors might be left wondering if the company can keep whipping up such satisfying numbers, or if they should anticipate the eventual digestion of these gains.
Balance sheet Analysis
The financial health of Johnson & Johnson (JNJ) over the trailing three years paints a picture of a company with a steadily growing asset base, blooming from $174,894,000 to $187,378,000, a figure that would make any financial gardener green with envy. It’s not just the assets that have been nurtured to grow; the total equity gross minority interest has sprouted from $63,278,000 to $76,804,000, flexing the company’s equity muscles by approximately $13.5 billion. It seems JNJ has been taking its financial vitamins, but without the need for water—cash flow is sufficient.
Yet, it’s not all sunshine in JNJ’s financial ecosystem. The company’s working capital turned negative in the TTM, suggesting that short-term assets might be playing a challenging game of hide and seek with short-term liabilities. Moreover, the net tangible assets are in the red, deeper than a surgeon’s ink marking a surgery site, reflecting substantial intangible assets on the balance sheet. However, with net debt showing a relatively stable landscape over the years, JNJ seems to be managing its debt without requiring a financial Band-Aid, indicating a robustness to its overall fiscal structure.
Cash Flow Statement Analysis
Johnson & Johnson’s cash flow statement, when observed through the lens of the trailing twelve months, resembles the stable but unexciting heartbeat of a long-distance runner rather than the erratic sprints and stops of a day trader’s portfolio. The company’s operating cash flow, while down from the $23,536,000 zenith two years prior, remained hearty at $20,278,000 TTM. This slight dip in operating vitality may have investors mildly raising an eyebrow, pondering whether it’s just a case of catching its breath or if the company is signaling a need to slow down the fiscal treadmill.
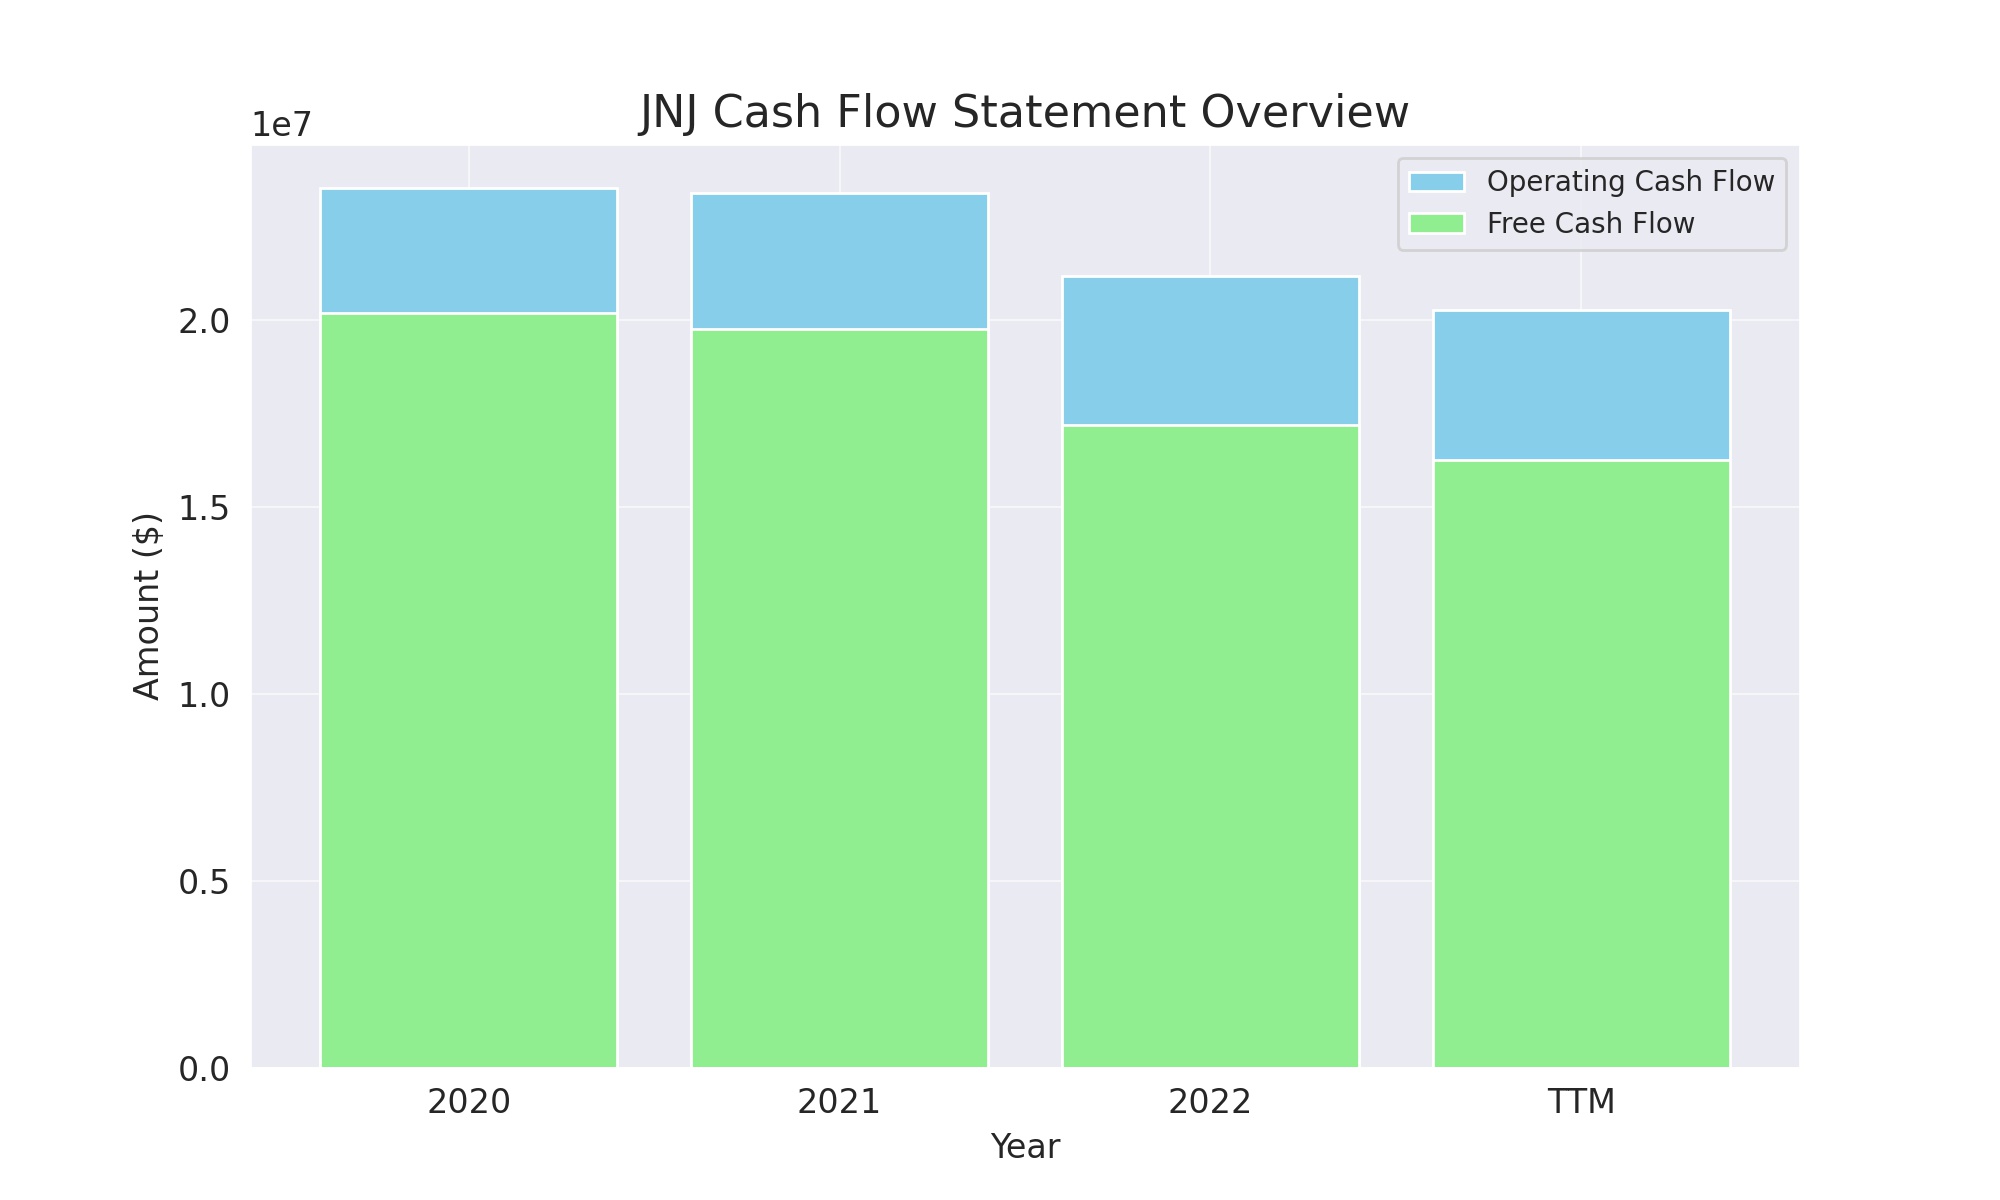
In the investing cash flow lane, JNJ seems to have taken a more conservative jog, reducing its outflow from a steep $20,825,000 to a more leisurely $2,317,000. This could be the financial equivalent of choosing a gentle yoga session over a high-impact aerobics class. Meanwhile, the financing cash flow paints a picture of a company that’s not so much splurging on financial luxuries as it is meticulously balancing its checkbook, with outflows consistently suggesting a preference for debt reduction and shareholder returns. The end cash position, standing at a comfortable $19,846,000, doesn’t scream lottery win, but rather a well-planned savings account, ready for a rainy day or a sunny investment opportunity, whichever the economic weather predicts.
SWOT Analysis
Conducting a SWOT analysis for Johnson & Johnson (JNJ) provides a comprehensive overview of its strategic positioning within the healthcare industry. This analysis will consider the company’s internal strengths and weaknesses, alongside external opportunities and threats that could impact its performance.
Strengths:
- Diverse Product Portfolio: JNJ operates across three major sectors: pharmaceuticals, medical devices, and consumer health products. This diversification allows JNJ to mitigate risks associated with market fluctuations in any single segment.
- Strong Research and Development (R&D) Capabilities: JNJ’s commitment to innovation is evidenced by its robust R&D pipeline, which consistently generates new products and enhances existing offerings, maintaining its competitive edge.
- Global Presence and Brand Reputation: With operations worldwide, JNJ benefits from its strong brand recognition and loyalty, underpinning its global sales and market penetration.
Weaknesses:
- Legal and Regulatory Challenges: JNJ has faced numerous legal battles and regulatory scrutiny over product safety and practices, impacting its financials and potentially tarnishing its brand image.
- Dependency on Patent-Protected Products: A significant portion of JNJ’s revenue comes from patent-protected drugs. The expiration of these patents can lead to increased competition from generic manufacturers, affecting revenue.
Opportunities:
- Growing Demand for Healthcare: Increasing global healthcare needs, particularly in emerging markets and aging populations, present significant growth opportunities for JNJ’s diverse product range.
- Expansion into Biotech and Digital Health: Investing in biotechnology and digital health innovations could open new revenue streams and improve patient outcomes, aligning with global health trends.
Threats:
- Intense Competition: The healthcare sector is highly competitive, with constant pressure from both established players and new entrants, which could challenge JNJ’s market share.
- Regulatory Pressures: Changes in healthcare policies and regulations, especially in significant markets like the U.S. and Europe, could impose additional compliance costs or limit market access.
This SWOT analysis highlights JNJ’s well-established position in the healthcare industry, leveraging its strengths to capitalize on opportunities. However, it must navigate inherent weaknesses and external threats to sustain its long-term growth and market leadership.
Competitors
Johnson & Johnson faces competition from a diverse array of companies within the pharmaceutical, medical device, and consumer health sectors:
- Pfizer Inc. (PFE): A leading global pharmaceutical company, Pfizer competes directly with JNJ in the development and marketing of medications and vaccines. Their broad product portfolio and strong R&D capabilities make them a formidable competitor.
- Merck & Co., Inc. (MRK): Known for its wide range of pharmaceutical products, vaccines, and animal health products, Merck is another key competitor, especially in the pharmaceuticals segment. Their innovation in oncology and vaccine development poses competition to JNJ’s offerings.
- AbbVie Inc. (ABBV): Specializing in biopharmaceuticals, AbbVie competes with JNJ in areas such as immunology and oncology. Their aggressive pursuit of biologics and specialty drugs, along with a strong pipeline, challenges JNJ’s market position.
- Medtronic plc (MDT): As a leading company in medical devices, Medtronic competes with JNJ’s medical device segment. They are known for their innovations in medical technologies, services, and solutions across a broad range of hospital and healthcare needs.
- Procter & Gamble Co. (PG): In the consumer health segment, P&G is a significant competitor with its wide array of health care products, personal care, and hygiene products. Their strong brand recognition and global presence rival JNJ’s consumer products division.