
Cincinnati Financial Corporation (CINF) is a distinguished player in the insurance sector, renowned for its comprehensive portfolio of property and casualty insurance products. The company operates through a family of companies, including The Cincinnati Insurance Company, which is pivotal in providing a wide range of policies encompassing commercial, personal, and excess and surplus lines insurance. Cincinnati Financial stands out for its commitment to stability, service, and long-term relationships with its policyholders and agents, leveraging a unique business model that emphasizes local presence and independent agency distribution.
A hallmark of Cincinnati Financial’s financial prudence and shareholder commitment is its remarkable achievement of increasing dividends for 62 consecutive years, earning it the prestigious title of a Dividend King. This elite status is reserved for companies with a proven track record of half a century or more of consecutive annual dividend increases, underscoring Cincinnati Financial’s robust financial health, disciplined capital management, and unwavering dedication to returning value to its shareholders. This exceptional dividend history not only reflects the company’s resilience and adaptability over the decades but also its capacity to navigate through economic cycles while maintaining a steadfast focus on growth and profitability.
Analyst Ratings
- Robert Farnam from Janney Montgomery Scott initiated coverage with a “Hold” rating on Cincinnati Financial, setting a price target of $110, which indicates a potential downside of -1.81% as of December 14, 2023.
- Charlie Lederer of Citigroup also started coverage with a “Hold” rating and set the same price target of $110, suggesting a -1.81% downside, dated November 22, 2023.
- Michael Phillips at Oppenheimer initiated coverage with a “Hold” rating on November 16, 2023, but did not provide a specific price target.
- Paul Newsome from Piper Sandler maintained a “Hold” rating on October 30, 2023, adjusting the price target from $105 to $110, which mirrors the -1.81% downside potential.
- Earlier, on October 6, 2023, Paul Newsome at Piper Sandler had maintained a “Hold” rating but adjusted the price target from $117 to $105, indicating a more significant potential decrease of -6.28%.
Insider Trading
Over the last 6-12 months, insider activity for the stock has showcased a mix of buy and sell transactions alongside numerous awards, reflecting a dynamic insider engagement with the stock. Notably, direct purchases and sales provide insights into insiders’ confidence and expectations about the company’s future.
- Dirk J Debbink made significant buy transactions, purchasing shares on multiple occasions, with a notable buy of 2,000 shares at $102.9798 each on December 5, 2023, followed by another purchase of 1,000 shares at $98.7809 each on October 30, 2023, and 1,000 shares at $98.3900 on May 25, 2023. These purchases suggest a strong belief in the company’s value.
- Nancy C Benacci also showed confidence by buying 1,000 shares at $106.5700 on September 12, 2023, indicating a positive outlook on the stock.
- Thomas J Aaron joined the buying trend with 500 shares at $97.1678 on June 1, 2023, further evidencing insider confidence.
- On the selling side, Charles O Schiff executed a notable sale, offloading 20,000 shares at $102.7388 each on May 17, 2023, marking a significant transaction that might reflect portfolio adjustments or profit-taking.
- Michael J Sewell (CFO & Treas) engaged in a sell post-exercise transaction, selling 5,319 shares at $108.7700 each on August 3, 2023, after exercising options, which could suggest capitalizing on the stock’s performance or diversifying personal investments.
These transactions, particularly the buys, may signal insiders’ optimistic views on the stock’s prospects, while sales post-exercise could be attributed to personal financial management rather than a lack of confidence in the company’s future.
Dividend Metrics
Cincinnati Financial Corporation (CINF) stands as a testament to consistent financial performance and shareholder commitment. With an impressive streak of 62 years of consecutive dividend increases, CINF firmly holds its place among the esteemed Dividend Kings. The company boasts a current yield of 2.68%, which slightly surpasses its five-year average yield of 2.51%. This could suggest that the stock is yielding more now than it has on average over the past five years, possibly due to a price drop or an increase in dividend payouts.
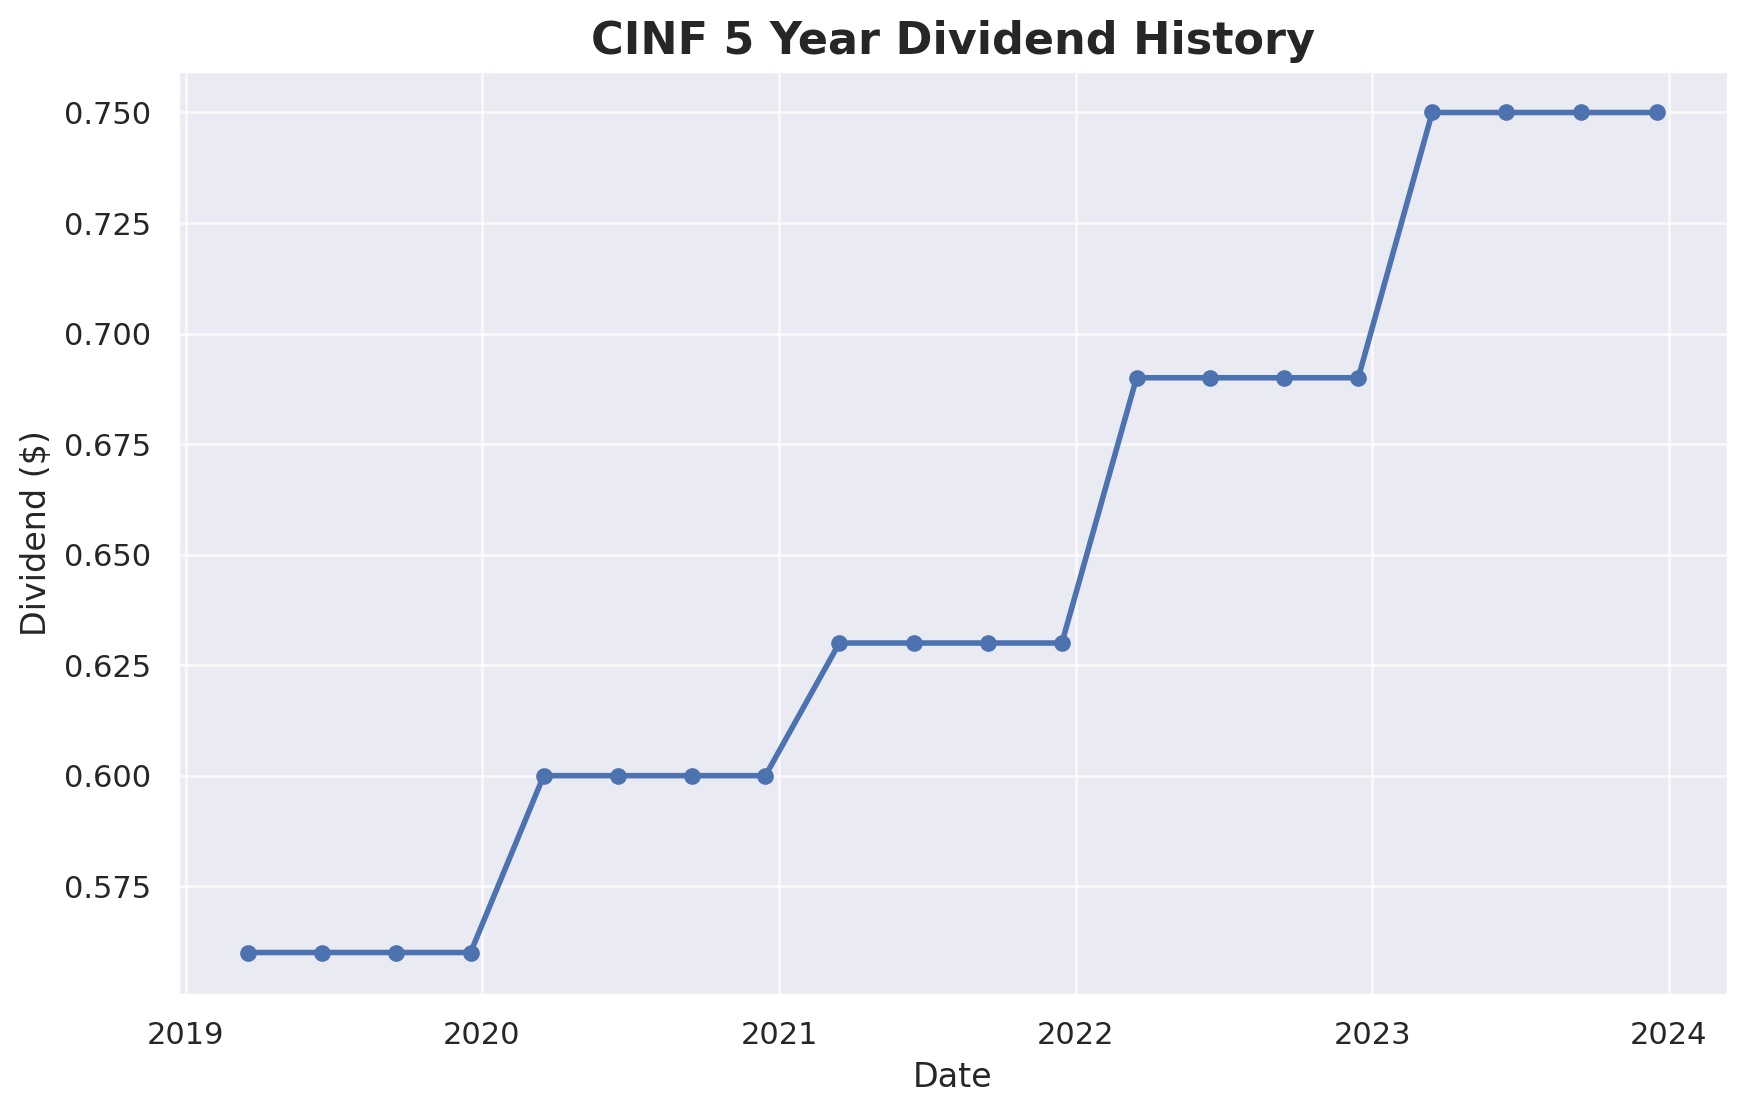
CINF has experienced a notable 6.14% dividend growth rate over the past five years, paired with a significant 28.40% one-year revenue growth, signaling a robust financial expansion. Despite this growth, the stock has encountered a slight retreat in its one-year return, posting a -1.99% dip. With a payout ratio of 27%, the company maintains a conservative approach, retaining a majority of its earnings for reinvestment and growth. This balance between rewarding investors and fueling future growth encapsulates CINF’s prudent financial strategy.
Dividend Value
Cincinnati Financial Corporation (CINF) currently offers a dividend yield of 2.68%, which stands above its five-year average yield of 2.51%. This higher yield may indicate that the stock is potentially undervalued compared to its historical pricing, suggesting an attractive entry point for dividend investors seeking stocks that may offer both income and capital appreciation potential.
Typically, an above-average yield could be the market’s response to a share price decline, offering a higher income return on investment at the current valuation. Alternatively, it might reflect a recent acceleration in dividend growth outpacing share price appreciation. For investors interpreting yield as a signal, CINF’s current yield premium to its five-year average could be seen as a beckoning for closer scrutiny, perhaps revealing a stock that’s ripe for picking in a garden where yields have been carefully cultivated over time.
Income statement Analysis
In the theatrical production that is the income statement of our protagonist, the total revenue has seen its ups and downs, much like a yoyo in the hands of a particularly enthusiastic player, reaching $9,766,000 TTM in 2022 after a dramatic dip in 2021 to $6,557,000. The total expenses, ever the loyal sidekick, have followed closely behind, though they took a curious leap in 2021 to $7,250,000, perhaps trying to steal the spotlight. Despite these antics, the pretax income in 2022 made a commendable comeback, soaring to $2,074,000 from a below-stage-level of -$693,000 TTM the previous year, as if it had rebounded on a financial trampoline.
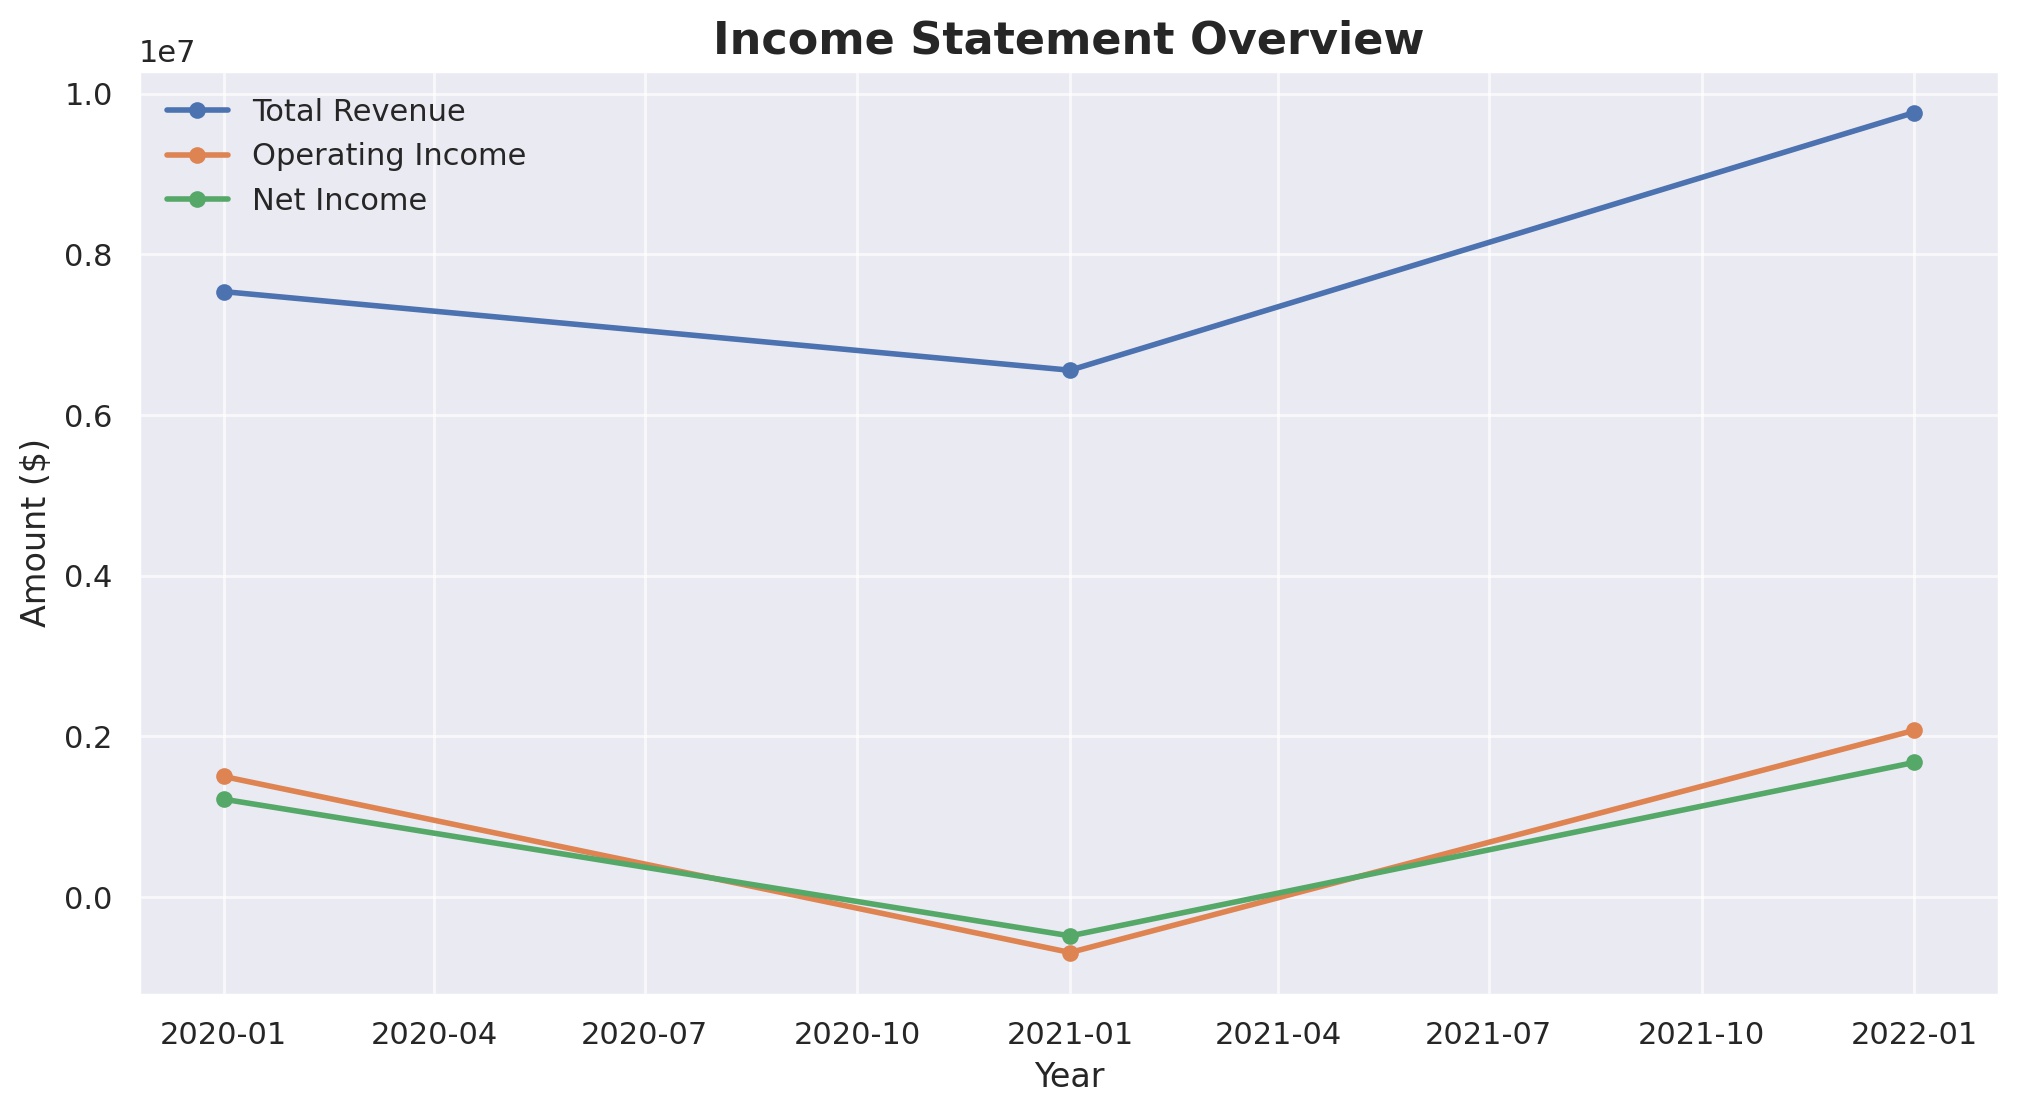
Net income, the plot’s twist, also took its cues from a riveting script, turning a sorrowful -$486,000 TTM narrative in 2021 into a triumph of $1,674,000 TTM. The earnings per share (EPS) echoed this dramatic arc, with basic and diluted EPS doing a tango from a lamentable -$3.06 to a spirited $10.53 and $10.56, respectively. The average shares watched from the audience, remaining relatively steady and seemingly unphased by the on-stage fluctuations, showing that in the grand theater of finance, the show must—and will—go on.
Balance sheet Analysis
On the balance sheet of our financial protagonist, total assets have played a game of financial leapfrog, jumping from $27,542,000 TTM in 2020 to a peak of $31,387,000 TTM in 2021 before slightly retreating to $29,736,000 TTM in 2022, as if to catch its breath. The total liabilities, not wanting to be left out, have also been on the move, climbing from $16,753,000 TTM to $19,205,000 TTM in the same period, perhaps in a bid to keep pace with the assets in this fiscal dance.
In a twist, the total equity gross minority interest swelled like a proud peacock in 2021 to $13,105,000 TTM, only to modestly shrink back to $10,531,000 TTM the following year, echoing the humbling nature of financial ebb and flow. The debt level, however,
remained as conservative as a librarian’s whisper, holding steady around $890,000 TTM across the board, which might suggest a company that uses leverage like a sparingly used spice rather than the main ingredient. Share count held firm, with ordinary shares numbering a disciplined 157,100 to 160,900 over the years, and treasury shares lingering in the neighborhood of 37,400 to 41,200, hinting at a stable share repurchase strategy. This balance sheet tableau paints a picture of a company with assets and equity doing a financial minuet, occasionally stepping on each other’s toes but always staying in tune.
Cash Flow Statement Analysis
For Cincinnati Financial Corporation (CINF), the cash flow statement over the last few years reveals a story of financial maneuvers that could rival the plots of high-stakes poker games. Starting with operating cash flow, the company has shown a commendable uptick, moving from $1,491,000 TTM in 2020 to an impressive $2,106,000 TTM by the end of 2022. This gradual ascent suggests that CINF has been increasingly efficient at converting its insurance premiums and investment activities into cold, hard cash, the lifeblood of any company’s operations.
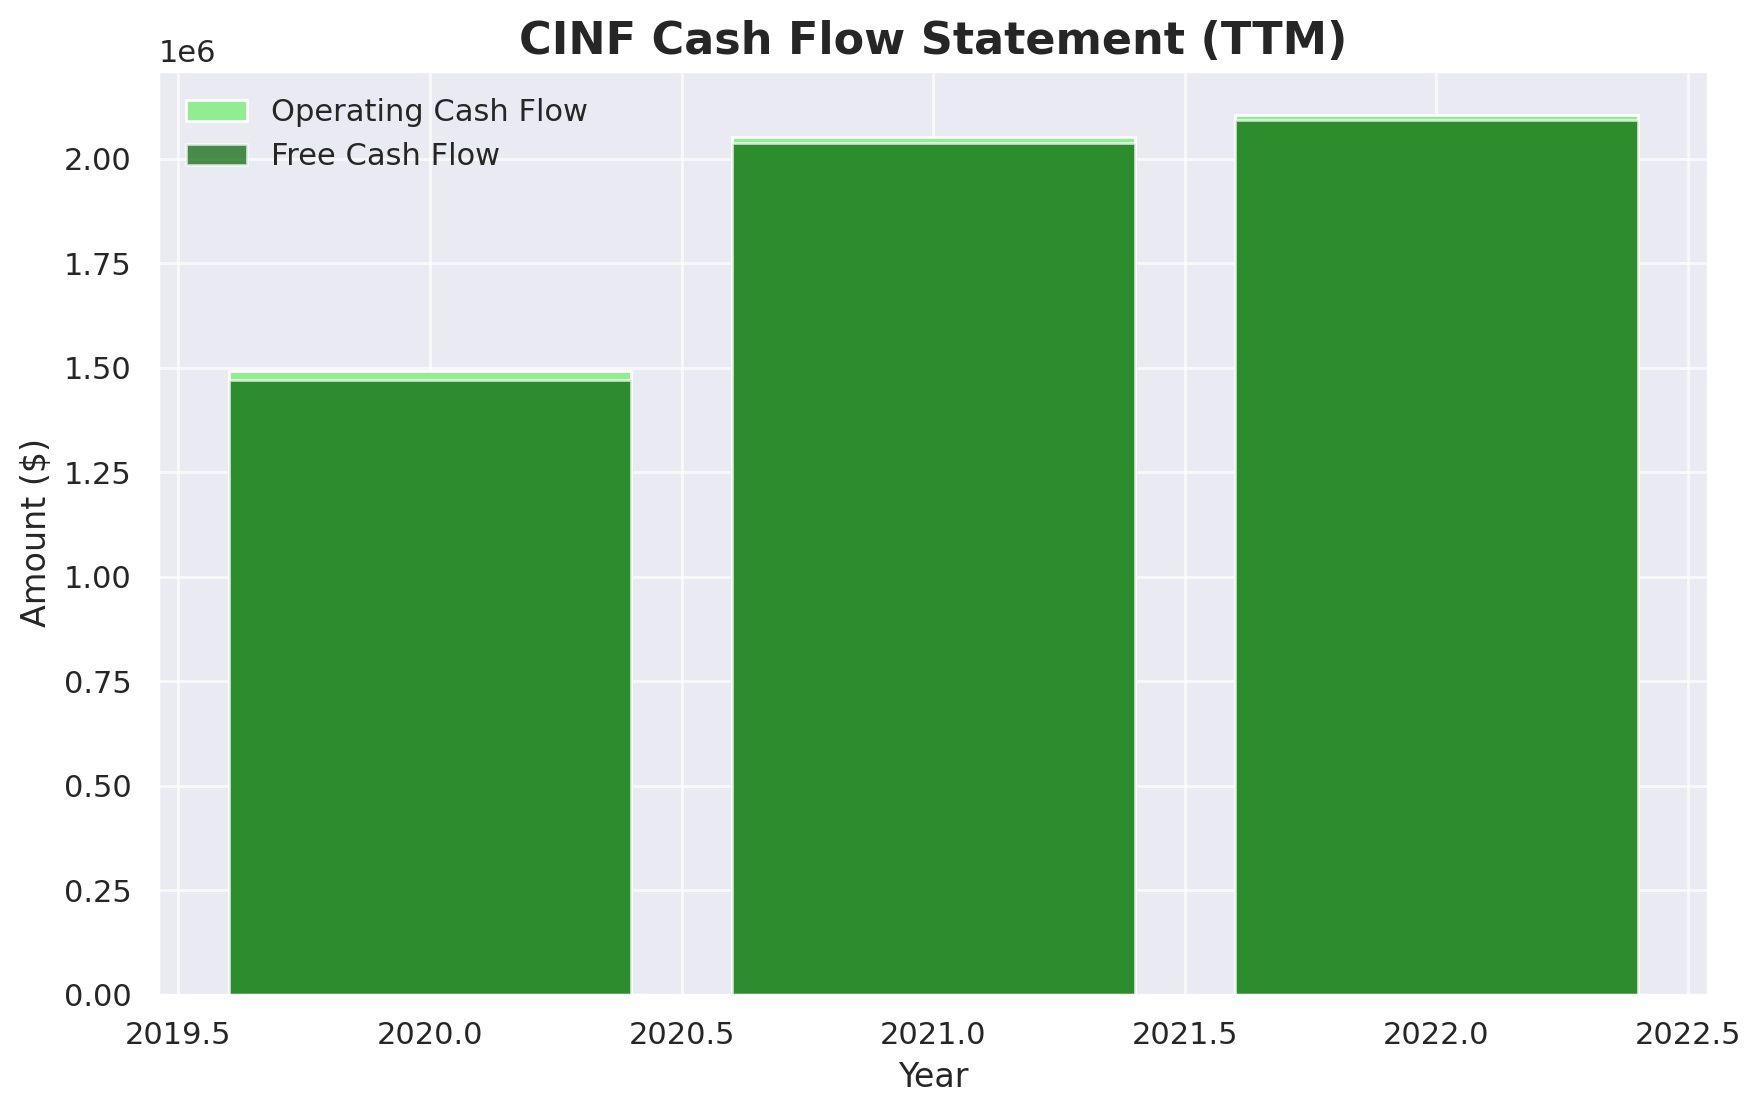
On the other side of the ledger, investing cash flow and financing activities paint a picture of a company that’s not afraid to shuffle its financial deck. With investing cash outflows peaking at -$1,525,000 TTM in 2022, it’s clear CINF has been investing heavily, possibly into securities or capital improvements to bolster its long-term prospects. Meanwhile, financing cash flows have seen a mix of inflows and outflows, with a notable -$765,000 TTM in 2022, reflecting perhaps a combination of debt repayments and share repurchases. Ending cash positions over the years show a slight dip from $1,264,000 TTM in 2021 to $899,000 TTM in 2022, hinting at a strategic bet that the investments made will pay off more handsomely than the cash resting idly in bank accounts. In the grand casino of corporate finance, CINF seems to be playing a careful game, betting on its future with a keen eye on maintaining a solid cash reserve.
SWOT Analysis
A SWOT analysis for Cincinnati Financial Corporation (CINF) offers a strategic look at its strengths, weaknesses, opportunities, and threats within the insurance industry.
Strengths:
- Long-standing Reputation: CINF, with its history of operational excellence, has built a strong reputation in the insurance industry, underscored by high customer loyalty and trust.
- Solid Financial Performance: The company’s consistent financial health, evidenced by a robust balance sheet and steady cash flows, positions it well within the market.
- Dividend History: A remarkable track record of increasing dividends for over 60 years, marking it as a Dividend King, highlights its commitment to returning value to shareholders and financial stability.
Weaknesses:
- Market Competition: Intense competition in the insurance sector from both traditional companies and new, tech-driven entrants can pressure premiums and market share.
- Exposure to Market Volatility: Being in the insurance industry, CINF is subject to underwriting risks and market volatility, which can affect investment income and operational costs.
Opportunities:
- Technological Advancements: Investing in technology and digital transformation can improve operational efficiency, customer service, and underwriting processes.
- Market Expansion: There are opportunities to expand into new geographic areas and product lines, further diversifying its portfolio and revenue streams.
Threats:
- Regulatory Changes: The insurance industry is heavily regulated, and any changes in laws or regulations could impact operations, costs, and profitability.
- Natural Disasters and Catastrophic Events: Such events can lead to significant claims, affecting the company’s financial performance and stability.
This SWOT analysis underscores CINF’s solid foundation in the insurance market while also highlighting areas where strategic initiatives could drive growth and mitigate risks.
Competitors
Cincinnati Financial Corporation (CINF) operates in a competitive insurance landscape, facing stiff competition from several key players. Here’s a brief overview of its top five competitors:
- State Farm: As one of the largest property and casualty insurance providers in the U.S., State Farm poses significant competition to CINF with its comprehensive range of insurance products, extensive agent network, and strong brand recognition.
- Allstate Corporation: Allstate stands out with its diverse insurance offerings, including auto, home, life, and commercial insurance, complemented by innovative digital platforms that enhance customer experience and operational efficiency.
- Progressive Corporation: Known for its auto insurance, Progressive also offers a wide array of insurance products. Its adoption of technology and data analytics for personalized rates and services makes it a formidable competitor in the market.
- Travelers Companies, Inc.: Travelers is a leader in commercial property casualty insurance and personal insurance. Its financial strength, broad product line, and history of risk management expertise position it as a key competitor to CINF.
- Chubb Limited: Chubb’s global presence and extensive portfolio of property and casualty insurance, accident and health insurance, and reinsurance products make it a significant competitor, especially in serving affluent individuals and commercial clients.