
American States Water Company (AWR) stands as a prominent figure in the utility sector, primarily engaged in the provision of water and electricity services across the United States. With a history rooted in 1929, AWR has established a strong foundation, serving as a reliable supplier of essential services to its customers. The company operates through two major segments: water and electric services, with water being its core business. AWR is known for its commitment to quality, sustainability, and efficient management of water and power resources, catering to both residential and industrial needs.
A hallmark of AWR’s financial robustness and shareholder value proposition is its remarkable record of increasing dividends for 68 consecutive years, making it a distinguished member of the Dividend Kings. This elite group comprises companies that have raised their dividends for at least 50 consecutive years. AWR’s consistent dividend growth reflects its stable earnings, prudent financial management, and commitment to returning value to its shareholders. This achievement underscores the company’s operational excellence and strategic foresight in navigating the complexities of the utility industry, solidifying its position as a stalwart investment for those seeking steady income through dividends.
Analyst Ratings
Here’s a summary of the recent analyst ratings for the stock:
- Gregg Orrill, UBS
- Upgraded the stock from Strong Sell to Hold on Jun 28, 2023, with the price target increased from $86 to $88, indicating an upside of +18.74%.
- Initially issued a Strong Sell rating with a price target of $92 on Nov 30, 2022, suggesting a +24.14% upside.
- Jonathan Reeder, Wells Fargo
- Downgraded the stock from Hold to Sell on Jun 28, 2023, adjusting the price target from $94 to $89, which represents a +20.09% upside.
- Previously upgraded from Sell to Hold on May 12, 2023, with a price target of $94, indicating a +26.84% upside.
- Maintained a Sell rating, adjusting the price target from $91 to $90 on Nov 9, 2022, with a +21.44% upside, and from $85 to $91 on Oct 31, 2022, indicating a +22.79% upside.
- Earlier, downgraded the stock from Hold to Sell on Oct 20, 2022, with a price target of $85, showing a +14.69% upside.
- Angie Storozynski, Seaport Global
- Downgraded the stock from Strong Buy to Hold on Jan 5, 2023, without specifying a new price target or expected upside.
These ratings reflect a mix of upgrades and downgrades over the specified period, indicating varying perspectives on the stock’s future performance from the analysts at UBS, Wells Fargo, and Seaport Global.
Insider Trading
Analyzing the buy and sell transactions (excluding awards and transfers) for the stock over the last 6-12 months provides insight into insider trading activities. Here’s a summary of these activities:
Buys
- Steven D. Davis bought 1,000 shares at $77.8990 on Nov 10, 2023, with a transaction total of $77,900. Post-transaction, Davis held 2,474 shares, representing 0.0067% ownership.
- Thomas A Eichelberger engaged in multiple purchases:
- Bought 1,000 shares at $77.9400 on Nov 09, 2023, totaling $77,940, increasing his holdings to 4,448 shares (0.0120% ownership).
- Earlier, on Aug 31, 2023, he bought another 1,000 shares at $84.8100 for a total of $84,810, with subsequent holdings of 3,448 shares (0.0093% ownership).
- On May 16, 2023, he purchased 2,000 shares at $89.9900, totaling $179,980, which increased his shares to 2,000 (0.0054% ownership).
Sells
- Anne M Holloway (Chair) conducted a sale on Nov 15, 2023, disposing of 400 shares at $82.0000 each, totaling $32,800. After this transaction, Holloway held 38,186 shares, equating to 0.1033% ownership.
- Sarah J Anderson sold a significant quantity of 11,794 shares on Apr 26, 2023, though the price is not listed, the transaction amounted to $1,059,455, leaving Anderson with 1,000 shares (0.0027% ownership).
These transactions reveal a mix of buying and selling activities among insiders within the specified period. Notably, Thomas A Eichelberger’s repeated purchases may indicate a positive outlook on the stock’s value from his perspective. Conversely, Anne M Holloway’s and Sarah J Anderson’s sales could suggest a variety of strategic decisions, such as portfolio diversification or personal financial planning, rather than a straightforward judgment on the company’s future prospects. Insider transactions are closely monitored by investors for hints about a company’s potential future performance, though they should be considered as part of a broader investment analysis.
Dividend Metrics
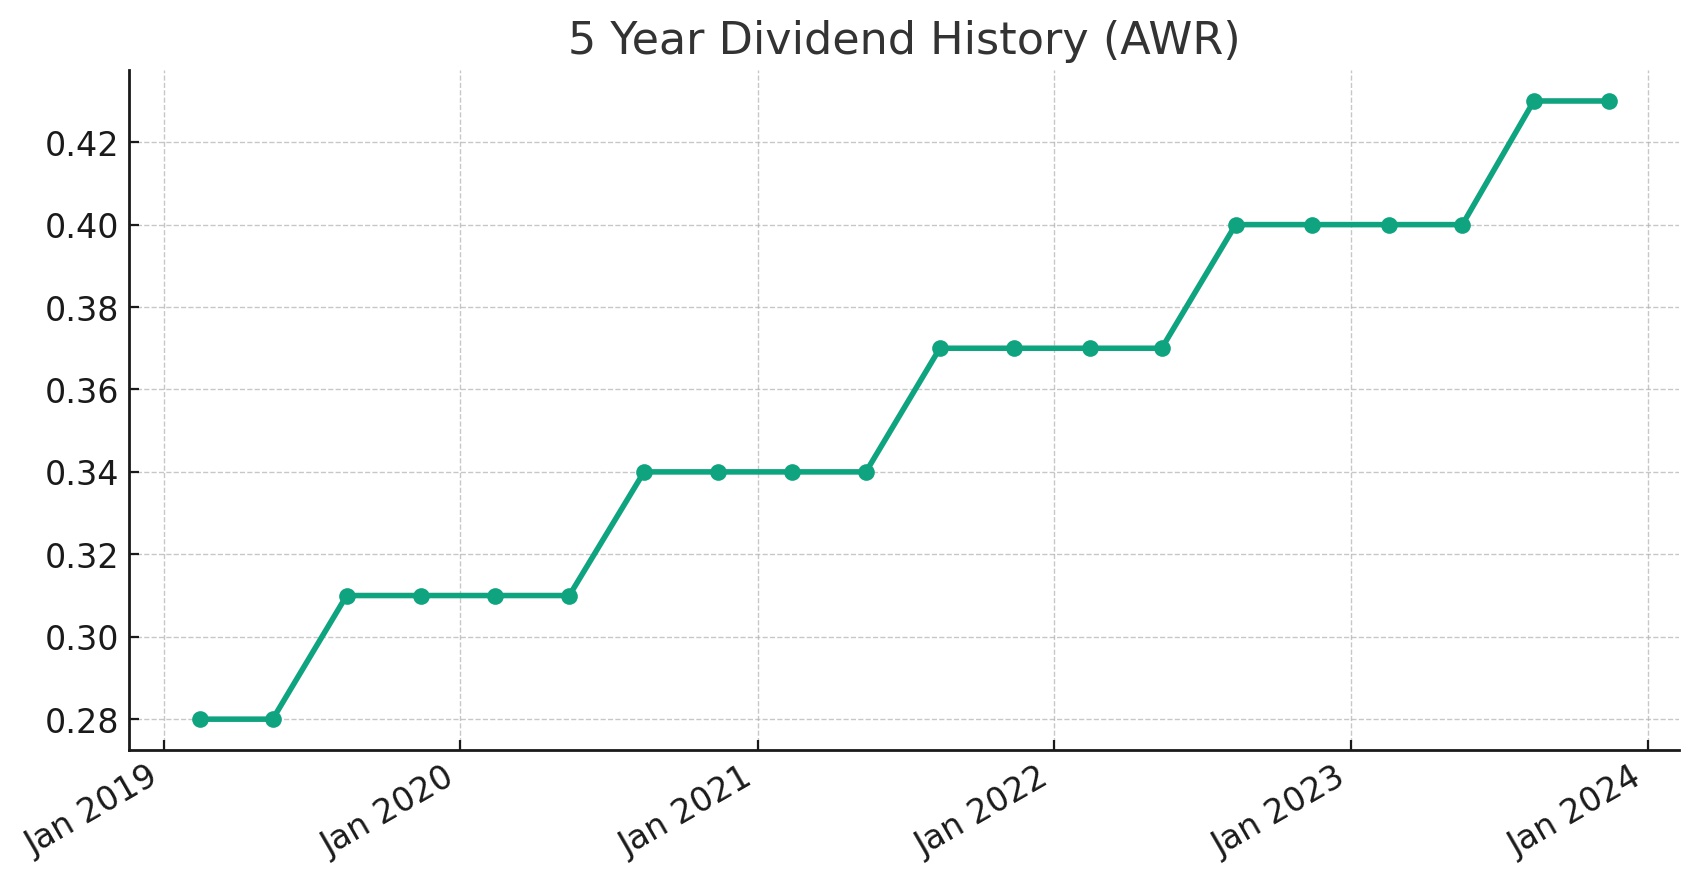
American States Water Company, with the symbol AWR, has a strong history of increasing its dividend, doing so for 68 consecutive years. The current yield stands at 2.29%, which is above the five-year average yield of 1.63%. Over the past five years, the dividend growth rate has been healthy at 8.97%.
The company has also experienced a solid one-year revenue growth of 12.40%. Its payout ratio, which is the proportion of earnings paid out as dividends to shareholders, is at 48%, indicating that less than half of the company’s earnings are being distributed as dividends, which could suggest a sustainable dividend policy. However, the stock has seen a significant downturn in performance over the past year, with the one-year return at -22.5%. This decline could reflect market conditions, company-specific events, or a broader economic downturn affecting the stock’s performance.
Dividend Value
American States Water Company’s (AWR) current dividend yield of 2.29% presents a favorable picture when compared to its 5-year yield average of 1.63%. This higher yield indicates that the stock is offering a better income return on investment relative to its own historical performance, potentially making it an attractive option for income-seeking investors.
The increase over the average suggests that the company’s market price has not kept pace with its increasing dividend payouts, which could signal undervaluation if the company’s fundamentals remain strong. As yields move inversely to stock prices, this higher-than-average yield might imply that the stock has not experienced price appreciation to the same extent as its dividend growth, which could attract value investors looking to capitalize on the disparity between yield and market valuation. However, as yields can be influenced by a variety of factors beyond historical averages, a thorough analysis beyond just the dividend yield would be necessary to provide a comprehensive valuation assessment.
Income statement Analysis
The income statement for the stock over the trailing twelve months (TTM) ending December 31, 2022, paints an amusingly rosy picture compared to the previous years, as if the company’s finances decided to go on a diet and ended up with a much fatter bottom line. Total revenue ballooned to a plump $595,886, a satisfying leap from $491,528 in 2021, and even outpacing the $498,853 from 2020. Cost of revenue did creep up to $144,415, but let’s not spoil the mood—gross profit puffed up nicely to $451,471, compared to the slimmer figures from the past, resting at $368,226 in 2021 and $377,824 in 2020.
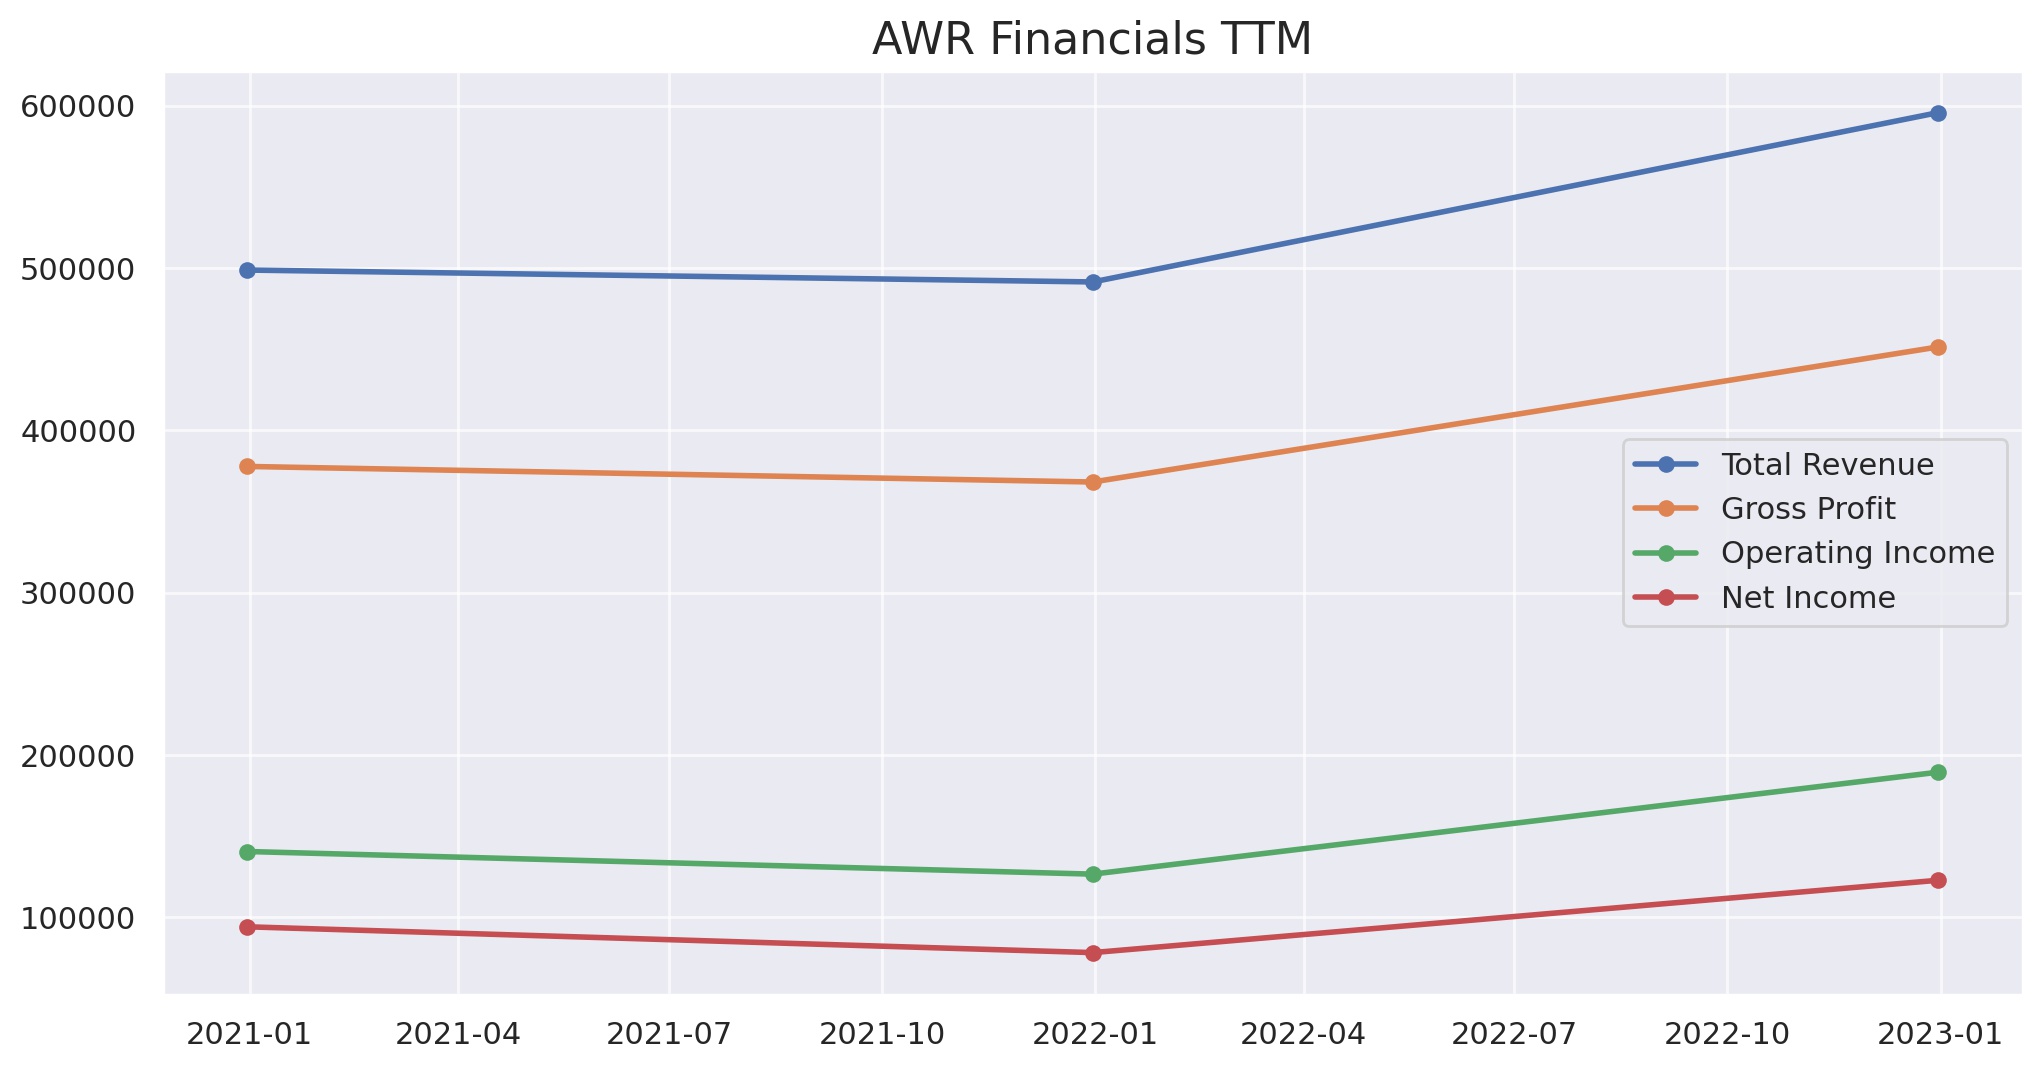
Operating expenses whispered to the gross profit, “You can’t sit with us,” at a table for $262,071, which was a modest hike from $241,665 in 2021. Yet, operating income didn’t just walk but sashayed to a striking $189,400, waving cheerfully at the $126,561 from the year before. Net income for common stockholders had its own glow-up, strutting to $122,787 from a more pedestrian $78,199 in 2021. It seems that every financial metric hit the gym, with basic EPS flexing at $3.33, up from $2.12, and even diluted EPS doing one better than last year at $3.32. The shares themselves didn’t miss out on the gains, with basic average shares slightly heavier at 36,970.75, and diluted average shares also tipping the scales a tad more at 37,061.50.
Balance sheet Analysis
Looking through the magnifying glass at the balance sheet for the trailing twelve months ending December 31, 2022, we find the total assets have grown quite fond of the upward trend, reaching $2,034,374, from $1,900,983 in 2021—assets seemingly in a growth spurt. Meanwhile, total liabilities net minority interest have been keeping up, climbing to $1,324,825 from $1,215,036 the year before, like a younger sibling trying not to be outdone. Total equity gross minority interest has also hopped onto the growth bandwagon, puffing up to $709,549 from a slightly less impressive $685,947 in 2021.
In a surprising twist, working capital seems to have decided to go on an adventure, diving deep into the negative at -$245,228 from a cozy positive $38,543 back in 2020—perhaps it fancied a bit of financial spelunking. On the other side of the ledger, net tangible assets have maintained their steady march upwards to $708,433. Total debt, perhaps feeling a little left out, has bulked up to $734,428, and net debt has similarly swelled to $718,449, both clearly not wanting to miss out on the growing trend. Share issued and ordinary shares number have remained relatively stable, showing that at least some things on the balance sheet decided to take a calm stroll rather than join the asset and liability race.
Cash Flow Statement Analysis
The cash flow statement for the trailing twelve months ending December 31, 2022, reveals that the company’s operating cash flow, which might as well be considered the company’s financial heartbeat, has taken a bit of a breather, slowing to $84,384 from the previous year’s more vigorous $117,799. Investing cash flow, with a flair for the dramatic, continues to play the role of the villain in our financial saga, draining away $180,546, a noticeable increase in expenditure compared to the slightly less extravagant $167,102 in the previous year.
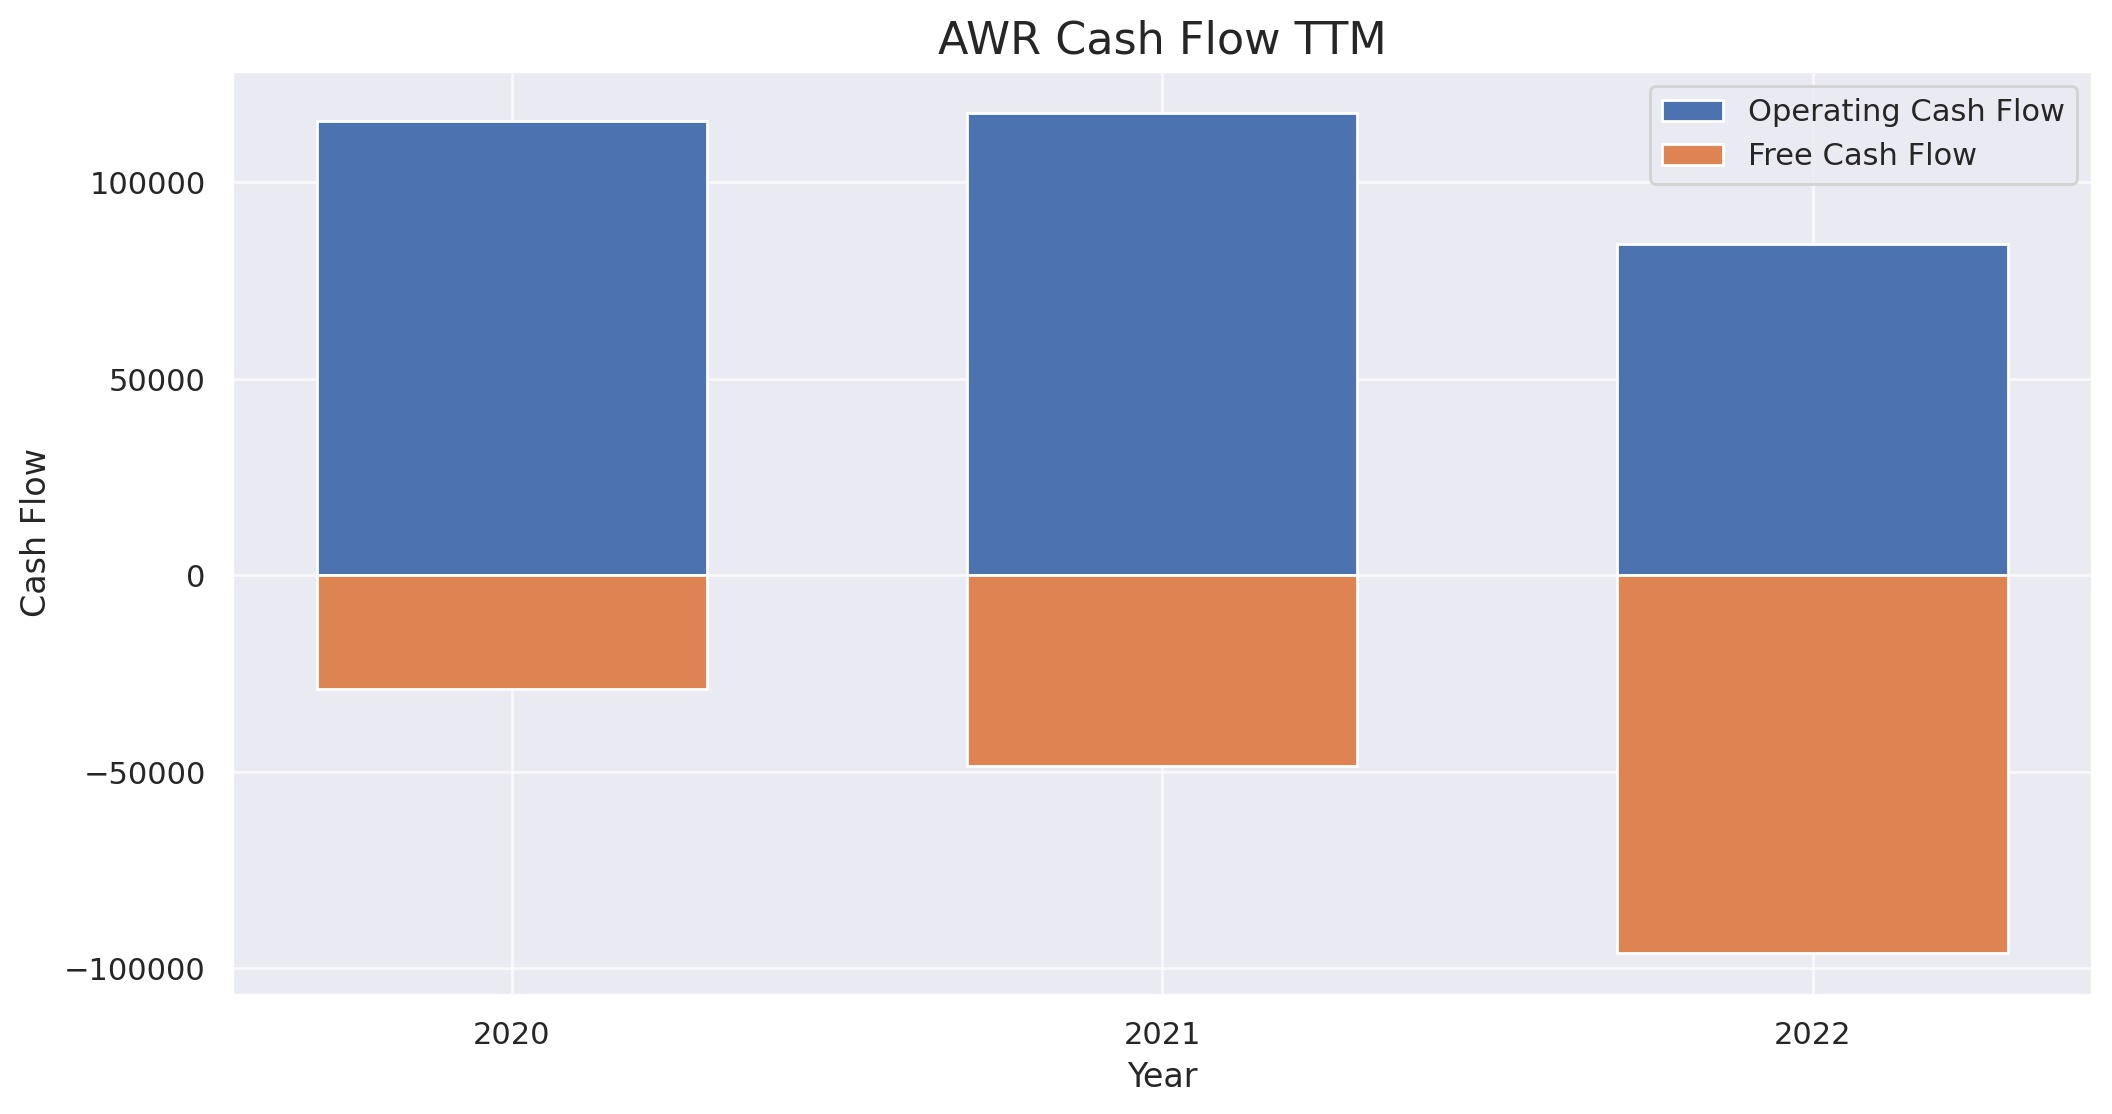
On the financing front, it seems the company has been quite the social butterfly, charming $102,508 into its coffers, which is a leap from the $50,337 in the previous period. However, the end cash position, sitting at $8,604, might feel a bit lonely compared to the bustling $36,737 from 2020. The free cash flow, in a plot twist that no one asked for, has dug itself into a hole at -$95,931, compared to a smaller pit of -$48,441 in the prior year. Meanwhile, capital expenditure and debt activities carried on with their own subplot, with capital expenditure nearly matching last year’s figure and issuance of debt stepping up its game to $165,628, as if saying, “What recession?”
SWOT Analysis
Strengths:
- Stable Dividend History: AWR has a long track record of consistently paying dividends, making it an attractive choice for income-seeking investors.
- Regulated Business: Being in the water utility industry, AWR operates in a regulated environment, providing a steady and predictable revenue stream.
- Diverse Operations: The company has diversified its operations through subsidiaries, including water and electricity services, reducing risk exposure.
- Strong Financials: AWR maintains a healthy balance sheet with a manageable level of debt and solid operating cash flows.
Weaknesses:
- Regulatory Risks: Being regulated, changes in regulatory policies can impact AWR’s operations and profitability.
- Dependency on California: A significant portion of AWR’s business is concentrated in California, making it vulnerable to regional economic conditions and environmental factors.
- Limited Growth Opportunities: As a regulated utility, AWR’s growth potential may be limited compared to more dynamic industries.
- Environmental Concerns: Increased awareness of environmental issues may lead to higher compliance costs and potential public scrutiny.
Opportunities:
- Infrastructure Investment: The need for infrastructure upgrades in the water and energy sectors could lead to growth opportunities for AWR.
- Renewable Energy: A shift towards renewable energy sources provides potential for diversification and sustainability.
- Acquisitions: AWR could explore strategic acquisitions to expand its reach and diversify its service offerings.
- Technological Advancements: Leveraging advanced technologies can enhance operational efficiency and customer service.
Threats:
- Economic Downturn: AWR’s business is sensitive to economic conditions, and a recession could impact demand and revenue.
- Climate Change: Increasing instances of extreme weather events and droughts could affect water availability and utility operations.
- Competitive Pressure: Competition from other utilities and potential market deregulation could impact AWR’s market share.
- Compliance Costs: Evolving environmental and regulatory standards may require significant investments in infrastructure and compliance.
Please note that this SWOT analysis provides a general overview, and specific investment decisions should consider additional factors and conduct a more in-depth analysis of the company and its industry.
Competitors
The main competitors of American States Water Company (AWR) in the stock market include:
- California Water Service Group (CWT)
- SJW Group (SJW)
- Middlesex Water (MSEX)
- Essential Utilities (WTRG)
- Pampa Energía (PAM)
These companies operate in the same “utilities” sector as AWR and are considered its main competitors in the industry. Keep in mind that this information is based on the data available at the time of the search, and the competitive landscape may change over time.