Illinois Tool Works Inc. (ITW) is an American multinational conglomerate company that operates across various segments including automotive, construction, electronics, food equipment, polymers and fluids, test and measurement, and welding. Founded in 1912, ITW has grown to become a global leader in diversified industrial manufacturing, boasting over 18,000 granted and pending patents. With a presence in 55 countries and employing approximately 45,000 people worldwide, ITW delivers specialized industrial solutions tailored to the needs of a wide range of industries.
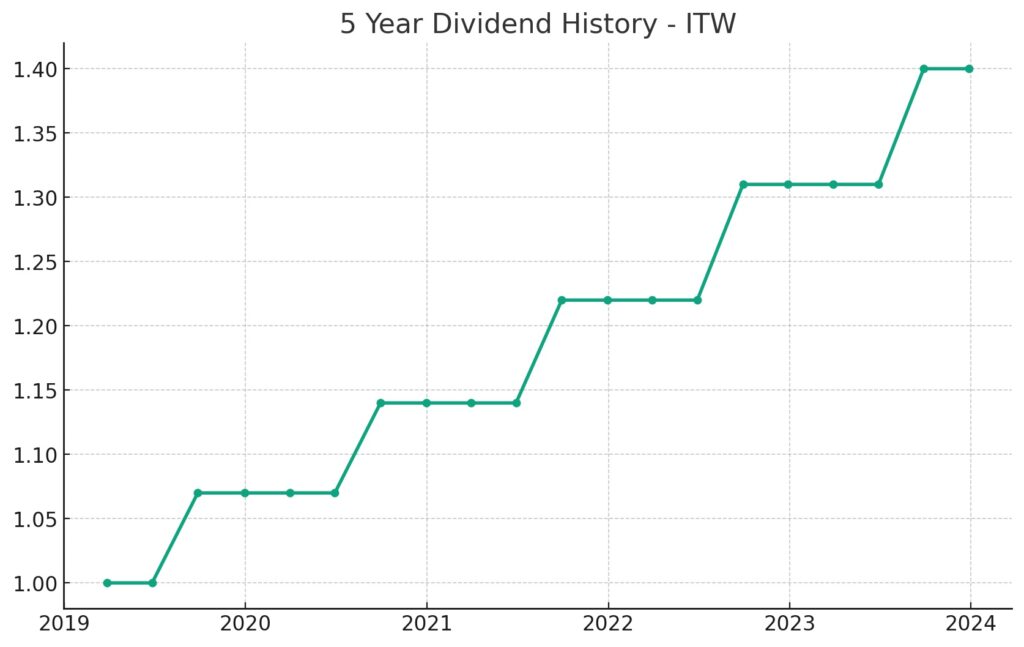
One of the most notable achievements of ITW is its impressive track record of dividend growth, having increased its dividend for 60 consecutive years. This achievement places ITW among the elite group of Dividend Kings, a testament to its financial stability, prudent management, and commitment to returning value to shareholders. The company’s consistent dividend growth reflects its robust business model and ability to generate steady cash flows even in fluctuating economic conditions. ITW’s long-standing policy of rewarding investors and its status as a Dividend King underscores the company’s enduring appeal to those seeking reliable dividend income.
Analyst Ratings
Recent analyst ratings for the stock reveal a mixed outlook with various actions including downgrades, maintains, and adjustments to price targets. Julian Mitchell from Barclays maintained a Sell rating, slightly raising the price target from $215 to $224, yet implying an 11.88% downside as of February 5, 2024. Nathan Jones of Stifel kept a Hold stance, with minor adjustments in the price target from $238 to $239 on January 23, 2024, suggesting a 5.98% downside. A notable downgrade came from Andrew Obin at Bank of America Securities, moving from Hold to Sell on January 10, 2024, with a price target decrease from $260 to $235, indicating a 7.56% downside.
Conversely, Joe O’Dea at Wells Fargo maintained a Hold rating but significantly increased the price target from $220 to $277 on December 19, 2023, forecasting an 8.97% upside. Similarly, Jamie Cook from Credit Suisse reaffirmed a Buy rating, with the price target going up from $281 to $292 on August 2, 2023, showing the highest optimism among the analysts with a 14.87% upside. Meanwhile, Citigroup’s Andrew Kaplowitz and JP Morgan’s Tami Zakaria showed more conservative optimism, maintaining their Hold and Buy ratings respectively, with slight adjustments to their price targets.
These ratings reflect a spectrum of perspectives on the stock’s future performance, ranging from cautious optimism to concerns about potential downsides, highlighting the diverse opinions among analysts regarding the stock’s valuation and future prospects.
Insider Trading
Over the last 6-12 months, insider transactions for ITW have shown a mix of buying, selling, and exercising options among the company’s top executives and insiders. Notably, David Byron Smith Jr. made a direct purchase on November 30, 2023, acquiring 1,000 shares at $241.79 each, bringing his total to 391,856 shares, representing a 0.1302% holding. This buy action is a positive signal, contrasting with several sell post-exercise transactions that indicate insiders capitalizing on their stock options.
Significant sell post-exercise actions were noted, such as Ernest Scott Santi, Chair & CEO, selling a substantial 235,656 shares on February 3, 2023, after exercising options, highlighting a major liquidity event for Santi but also demonstrating confidence in cashing in on the company’s current stock value. Christopher A O’Herlihy, Vice Chair, also participated in a notable sell post-exercise transaction on the same day, selling 60,137 shares. These sales follow a pattern where insiders exercise their options and sell the shares, possibly to diversify their investment portfolio or realize gains.
The contract buys by insiders such as Darrell L Ford and Daniel J Brutto on November 3, 2023, and other dates, although smaller in volume compared to sales, still indicate ongoing insider confidence in the company’s stock. The transaction activities, including both buys and sells, reflect a dynamic insider trading environment within ITW, showcasing a balance between gaining from stock appreciation and continuing investment in the company.
Dividend Metrics
Illinois Tool Works Inc. (ITW) has established a commendable track record in the financial markets, evident through its robust dividend history and solid stock performance metrics. The company has consistently increased its dividend for 59 years, showcasing its dedication to shareholder returns. With a current dividend yield of 2.11%, ITW not only offers a substantial income stream for investors but also demonstrates an impressive 5-year dividend growth rate of 13.42%.
The firm’s revenue growth over the past year has been modest at 0.50%, reflecting steady business performance. The payout ratio stands at 51%, indicating that a little over half of the company’s earnings are returned to shareholders as dividends, which underscores a balanced approach to distributing profits while retaining earnings for potential reinvestment. Over a 5-year period, the average dividend yield has been slightly higher at 2.3%, suggesting a relatively consistent yield for investors over time. Furthermore, ITW has provided a notable 1-year return of 10.96%, indicating strong recent stock price appreciation and a positive outlook from investors. Together, these metrics paint a picture of a company with a strong commitment to dividends and an encouraging financial profile.
Dividend Value
Illinois Tool Works Inc. (ITW) presents an intriguing yield-based value proposition when juxtaposed with its historical performance. Currently, ITW’s dividend yield stands at 2.11%, which notably hovers below its 5-year average yield of 2.3%. This variance suggests that the stock has seen a price appreciation outpacing the growth of its dividends, or that the dividend growth has not kept pace with investors’ expectations, reflected in the stock price. This could potentially signal to value investors that the stock may be somewhat overvalued relative to its historical yield performance or that the market has expectations of continued robust financial health that could drive future dividend increases. From an income investment perspective, the stock’s current yield offers less immediate income than the average over the past five years, which might lead yield-focused investors to ponder the stock’s appeal in the context of current market conditions and the company’s ability to sustain its historical dividend growth trajectory.
Income statement Analysis
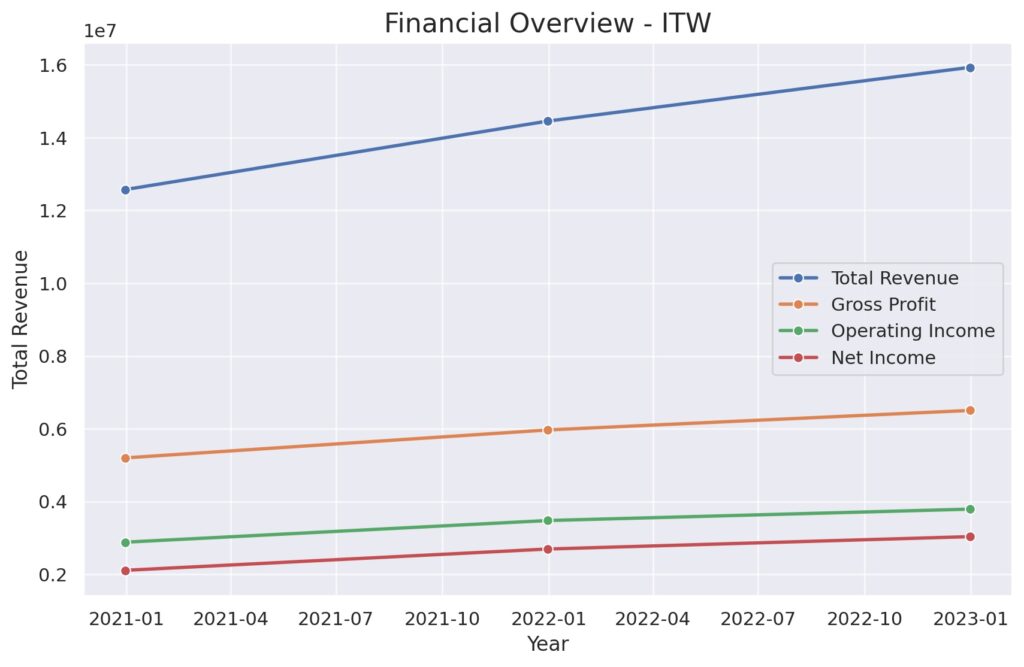
In the theatrical world of finance, the income statement for the trailing twelve months (TTM) through December 31, 2022, plays out like a success story, with total revenue taking center stage at $16,095,000. This top-line number has been enjoying the spotlight, showing a steady climb from $12,574,000 in 2020. Meanwhile, the cost of revenue, playing the persistent antagonist, also rose to $9,313,000, but it couldn’t keep up with the revenue’s lead role, allowing gross profit to enjoy a healthy slice of the pie at $6,782,000.
Down in the trenches of operating expenses, the figures managed to keep a lid on growth, only slightly up to $2,744,000, setting the stage for operating income to showcase a strong performance at $4,038,000. It seems the net non-operating interest income expense didn’t get the memo about keeping costs down, posting a minor figure of $-230,000. The plot twist comes with the pretax income, which, after accounting for all the dramatic turns, tallied up to $4,017,000. While the tax provision demanded its cut of $870,000, the net income available to common stockholders still walked away with a cool $3,147,000, marking a finale that would make any financial director nod appreciatively, even if the basic EPS, at a humble $10.33, didn’t quite get a standing ovation.
Balance sheet Analysis
As the curtain rises on the balance sheet for the year ending December 31, 2022, we witness total assets taking a slight bow to $15,422,000, modestly lower than the previous year’s more boastful $16,077,000. It seems assets couldn’t resist the gravitational pull of depreciation and other financial entropy. On the liabilities front, however, there’s a sense of déjà vu; total liabilities net minority interest show remarkable consistency, almost as if they’ve found their comfort zone around the $12,400,000 mark for the past three years, with a minor dip to $12,333,000 in 2022.
On the equity stage, total equity gross minority interest had a bit of a wardrobe malfunction, dropping from a more robust figure of $3,626,000 in 2021 to a leaner $3,089,000. It seems the equity decided to go on a diet without much fanfare. Meanwhile, net tangible assets, perhaps playing the part of the invisible man, have managed to remain in the negative spotlight, a performance that may not thrill the value-seeking crowd. Working capital, ever the supporting actor, has taken a significant step back from its 2020 peak performance of $3,934,000, settling at a more understated $1,810,000, perhaps hinting at a strategic shift or a sequel set up for the next fiscal year.
Cash Flow Statement Analysis
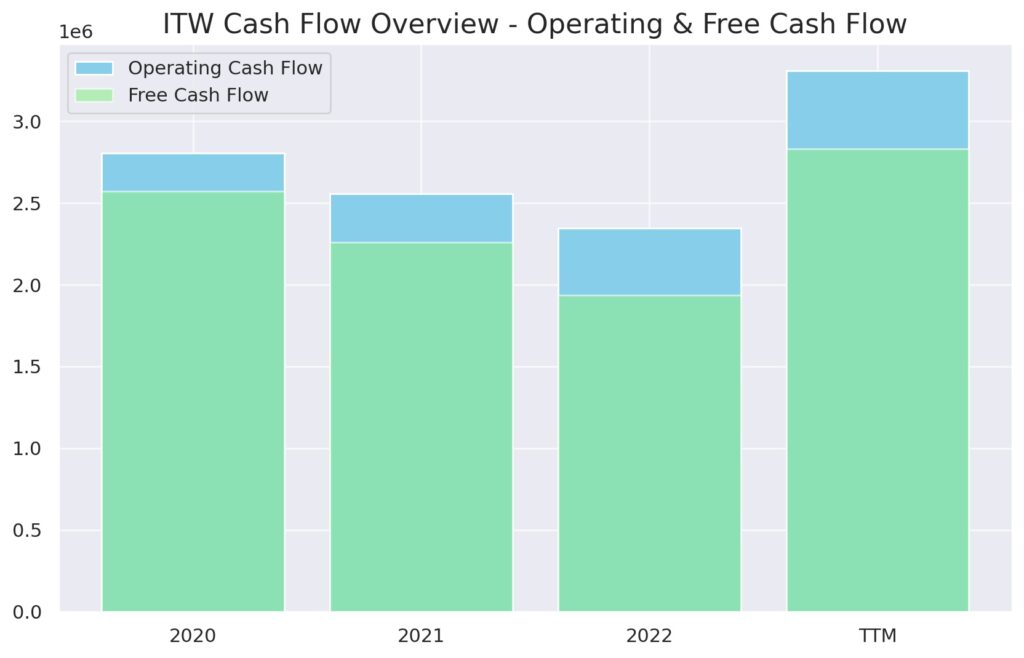
In the latest act of the fiscal drama, the cash flow statement for the trailing twelve months (TTM) reveals that operating cash flow has taken the lead role with a robust performance of $3,311,000, upstaging its previous years with an encore that surpassed even 2020’s $2,807,000. Investing cash flow, on the other hand, played a bit part, a mere $-156,000, which in the grand scheme of things, didn’t cause much of a scene compared to 2020’s dramatic $-984,000. It seems that investing activities have decided to avoid the limelight, preferring a more minimalist approach.

Meanwhile, financing cash flow seems to be auditioning for the role of the villain, with an outflow of $-2,940,000. It’s as if it’s trying to finance a blockbuster movie with a plot twist, but ended up with a straight-to-video release instead. The end cash position, sitting at $989,000, might not be enough for a swanky Hollywood after-party, especially when you compare it to the 2020’s flush $2,564,000. And let’s not forget the subplot of capital expenditure, which at a discreet $-480,000, whispers of quiet investments rather than splashy spending sprees. The script of the cash flow narrative tells a tale of prudent management, cost control, and perhaps a careful preparation for future acts yet to unfold.
SWOT Analysis
A SWOT analysis for Illinois Tool Works Inc. (ITW) would look at the company’s internal strengths and weaknesses, as well as external opportunities and threats that could impact its performance:
Strengths:
- Diversified Product Portfolio: ITW operates in various segments, providing a diversified range of products that serve different industries, which can stabilize revenue streams.
- Innovation and Patents: A strong focus on innovation and a robust patent portfolio protect ITW’s products and services, ensuring a competitive edge.
- Operational Efficiency: ITW’s decentralized organizational structure allows for agility and swift decision-making within its numerous business units.
- Strong Financial Performance: ITW has a history of strong financial performance, with a consistent dividend increase over the past 59 years, making it a member of the Dividend Kings.
Weaknesses:
- Dependence on Industrial Economy: ITW’s performance is closely tied to the industrial economy, which can be cyclical, affecting sales and profits.
- Competition: ITW faces intense competition from other industrial manufacturers, which could pressure margins and market share.
- Complexity of Operations: Managing a large and diverse portfolio of businesses can lead to operational complexities and inefficiencies.
Opportunities:
- Global Expansion: There is significant room for growth in emerging markets, which ITW can capitalize on, particularly in Asia and Latin America.
- Technological Advancements: ITW can leverage new technologies, including automation and data analytics, to enhance its manufacturing processes and product offerings.
- Acquisitions: Strategic acquisitions could open up new markets and technologies, fueling further growth.
Threats:
- Economic Downturns: Slowing global economic conditions could reduce demand for ITW’s industrial products.
- Trade Tensions and Tariffs: International trade conflicts could lead to tariffs, affecting ITW’s supply chain and cost structure.
- Rapid Technological Change: The fast pace of technological innovation could render some of ITW’s products obsolete if not continuously updated.
This SWOT analysis provides a lens through which to view ITW’s strategic positioning, highlighting the need to leverage its strengths and opportunities while mitigating its weaknesses and external threats.
Competitors
Illinois Tool Works Inc. (ITW) is a Fortune 200 company and a global industrial manufacturer, which means it competes with several large and diverse firms. While I can’t browse for the most current competitors, here are ITW’s traditionally recognized top competitors based on industry knowledge up to April 2023:
- 3M Company (MMM): Known for its innovation and a vast array of products, 3M operates in segments that overlap with ITW’s, including industrial manufacturing and technology.
- Stanley Black & Decker, Inc. (SWK): Stanley Black & Decker is a leading global tool manufacturer which competes with ITW in the tools and storage segments.
- Dover Corporation (DOV): Dover is a diversified global manufacturer that provides equipment and components, specialty systems, consumable supplies, software and digital solutions, and support services through various operating segments.
- Fortive Corporation (FTV): Formed as a spin-off from Danaher Corporation, Fortive is an industrial conglomerate with businesses in fields such as industrial technologies, professional instrumentation, and transportation technologies.
- Honeywell International Inc. (HON): Although broader in scope, Honeywell competes with ITW in various industrial markets, including safety products, performance materials, and aerospace technologies.


